Arkansas Rice Update 8-15-25
Arkansas Rice Update 2025-21
August 15, 2025
Jarrod Hardke & Scott Stiles
“And I’ve been learning that believing and that barely breaking even, it’s just a part of life for you and me.”

Stupid Hot
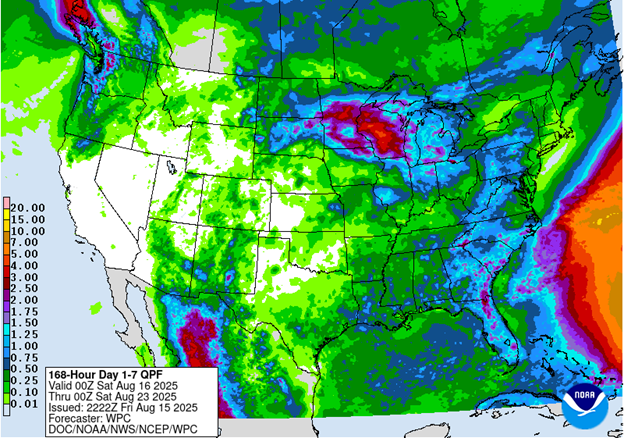
It’s time to go both fast and slow at the same time for harvest. Be slow to drain and fast to jump in to get the rice out. This kind of heat continuing for now is giving incentive to a slow play. The ground will dry fast once irrigation stops / draining starts. Rice seems to be maturing out very fast this past week even in fields that previously looked like they might be dragging out. Hopefully conditions are going to start changing by the end of next week but now is not the time to depend on the weather working in our favor.
Early harvest reports are still relatively few but southern Arkansas is starting to pick up steam. The south part of central Arkansas is also finding increasing progress. North of I-40 is only just getting into the game. Yield reports so far are mostly average with some exceptional fields scattered in. However, we haven’t reached the point of having many yield reports from the area I’m most concerned with, which is the band that runs through the northeast that was most affected by the April flood.
Milling? Even fewer reports as it takes a little time to get lots closed and milled. Let’s just say I hope it gets better because it’s starting out below average and some of it similar to last year. I’m tired of this, Grandpa.
A big topic of the week has been acreage and markets of course. More on that below from both the side of certified acres and the WASDE report.
Read on below for more information on certified acreage and markets.
Let us know if we can help.
Listen to the Podcasts:
Fig. 1. NOAA 7-day precipitation forecast.
Ricing Around
Jarrod Hardke
Harvest Aids in Rice
Earlier this week I already posted the below article on harvest aids in rice to the Arkansas Row Crops blog due to the number of questions being received. I’m including it again here in the newsletter in case you didn’t see that post. Here is a link to a pdf version of the article for those that want to download a clean version of it: Harvest Aids in Rice.
The use of sodium chlorate (salt) as a harvest aid in rice can be an excellent tool when needed, but it can hurt us when used incorrectly. Here are some guidelines we’ve developed to assist with maximizing the benefits of this tool while minimizing the risks if you choose to use sodium chlorate (salt) as a harvest aid. Please read through all of the guidelines as some of the comments overlap in attempting to logically answer all of the questions we usually receive.
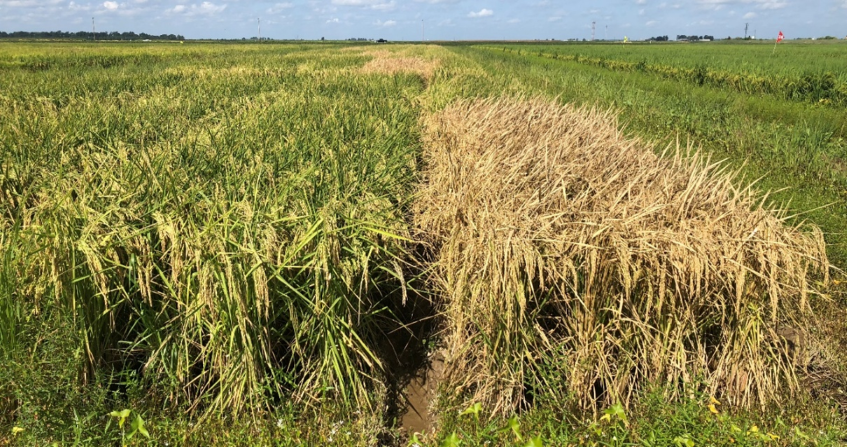
Fig. 2. Research plots receiving sodium chlorate (right) versus untreated check.
- Determining initial grain moisture
Often at higher moisture levels we’re more interested in collecting a hand sample rather than put a combine in the field just to see where our starting point is. A hand sample is fine, but it has limitations. Add AT LEAST 2% to the moisture level you get from a hand sample, and often adding 3% is needed. We pull a lot of hand samples preparing for plot harvest and frequently find that the difference between a hand sample and a combine sample is 2-3% (a hand sample is always lower moisture – higher moisture grains are difficult to remove by hand).
- What moisture is safe to begin applying sodium chlorate to rice?
Varieties should be below 25% grain moisture before applying sodium chlorate (e.g., Ozark, DG263L, CLL18, etc.).
Hybrids should be below 23% grain moisture before applying sodium chlorate (e.g., RT 7302, RT 7521 FP, etc.).
While these moisture levels are safe, we need to be smart about how we proceed to achieve the outcomes we want. Depending on your target harvest moisture, we may need to wait longer. Some want moisture below 20% for harvest while others may need rice to be below 18%.
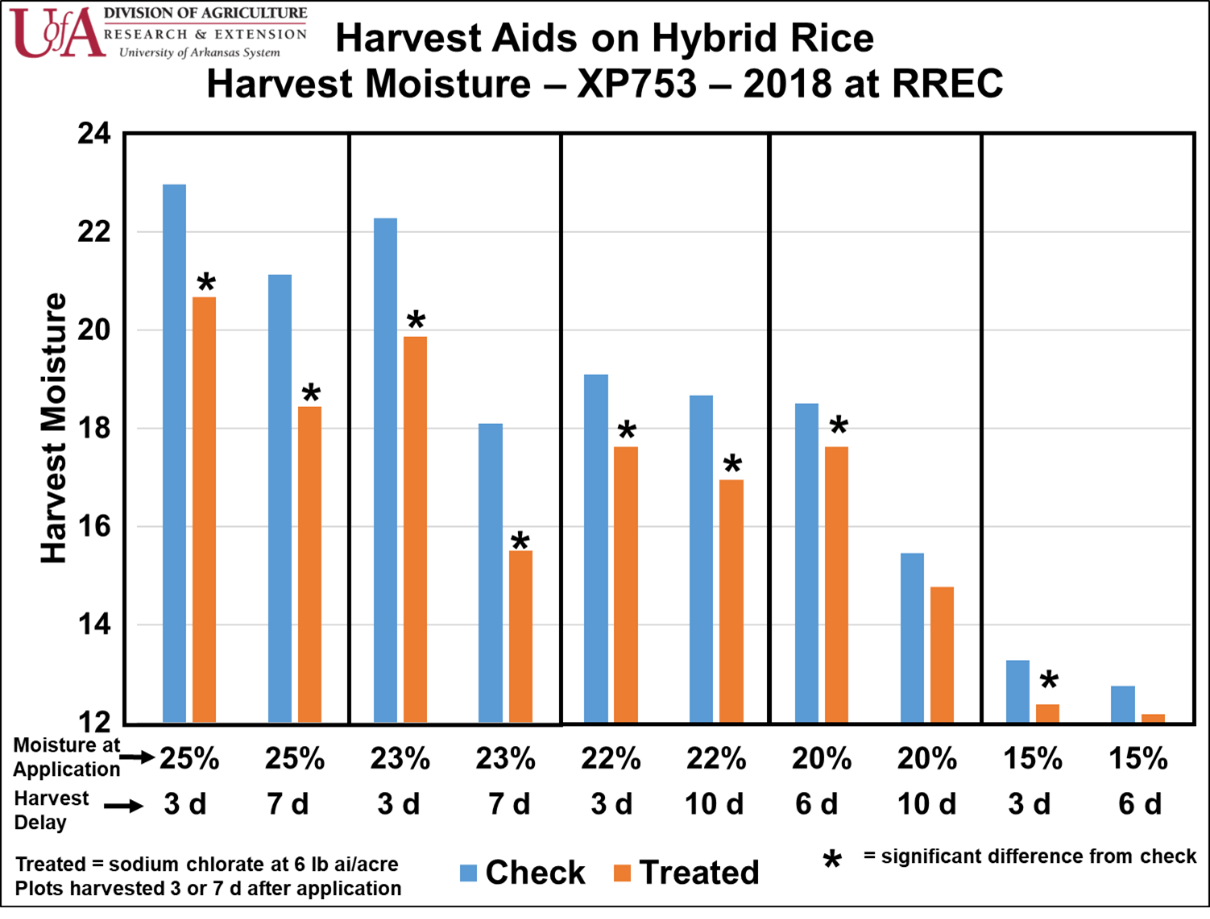
Salted rice can drop in moisture approximately 1% per day depending on conditions compared to 0.5% per day for rice that hasn’t been salted. A simpler way to put it is that salt initially takes out ~2% of grain moisture and after that grain moisture trends down similarly regardless of whether rice is salted or not. So, if salting at 23% and wanting to start harvest at 18%, you’ll need to wait 5 days before starting harvest (which is too long – more on that below).
Fig. 3. Use of sodium chlorate and effect on grain moisture of RT XP753 hybrid rice in trials in 2018. Sodium chlorate applied at different grain moisture levels and harvested at 3 or 7 days after application (weather dependent).
- What rates of sodium chlorate should I use?
Sodium chlorate is mostly available as a 5 lb a.i. per gallon product (1 gallon of product contains 5 lbs of active ingredient). We’ve most commonly evaluated rates ranging from 3 lb a.i. to 6 lb a.i. (0.6 to 1.2 gal product per acre) but for simplicity you can think of ½ gallon to 1 gallon as comparable rates. When comparing 3 lb to 6 lb applications, we haven’t seen much difference – but higher rates can give more uniformity and more consistent drydown of the overall plant. The grain moisture response was very similar as was upper canopy desiccation.
- When should I start harvest?
Start in 2-3 days and complete harvest in 5 days or less after application of sodium chlorate. Waiting longer can allow heavy dew and/or rain events to cause milling issues. Also, the entire panicle can get drier, becoming more susceptible to shattering. Risks for milling and yield loss increase the longer harvest takes beyond 5 days after application. Avoid salting too far ahead of the combine.
- When should I stop applying sodium chlorate?
Once moisture falls below 18%, exercise caution when using sodium chlorate. Long-grains don’t seem to have as much risk below 18%, but medium grains should NOT be salted once they fall below 18%.
If salting long-grains at lower moistures, consider using a lower rate of sodium chlorate – 2.5 to 3 lb a.i. (0.5 to 0.6 gallons) and begin harvest the following day after application – complete harvest within 3 days of application.
- Lodged rice
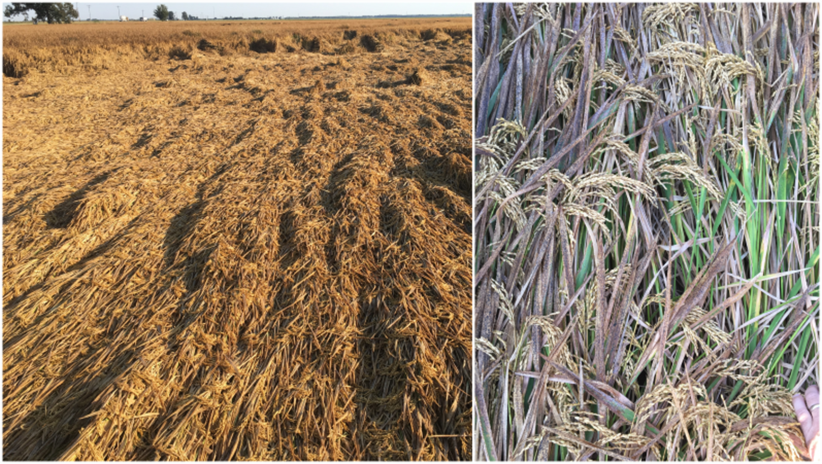
Don’t salt rice that has lodging. The salt will only work on the plants contacted by the application, meaning severely dried plants on top and still green plants underneath. It becomes a blended mix of wetter and drier grains. Fields with only small areas of lodging are not of great concern.
Fig. 4. Lodged rice (left); top layer of rice versus underneath layer after salting (right).
- Additional thoughts
Don’t salt rice solely on the basis of rapidly lowering grain moisture and expect a major moisture reduction. In research trials, whether harvested 3 or 7 days after application, salted plots were typically only 2% lower grain moisture than plots that weren’t salted.
In 2019 when we looked at multiple cultivars starting at 20-22% moisture, it turned very hot and moisture fell 1% per day (without applying salt). So, in 7 days we observed a fall from 20-22% moisture to 13-15% moisture (the average high those 7 days was 95). Use caution under these conditions. Moisture dropping to very low levels in long grains is not necessarily going to cause excessive milling issues as long as it’s harvested immediately so that no re-wetting and drying can occur. Medium grains allowed to drop to these low moisture levels will generally see greater penalties in milling yields.
- Quick Take-Homes for Sodium Chlorate (salt) as Harvest Aid in Rice
-
Only salt once rice is below 25% for varieties or 23% for hybrids.
-
Expect only 3-5% moisture drop by 5 days after application.
-
Complete harvest in 5 days after application.
-
Do not salt medium-grains below 18% moisture.
-
If salting long-grains below 18% moisture, begin harvest the following day and complete harvest by 3 days after application.
-
DO NOT get too far ahead of the combine with salt applications.
-
Avoid salting rice with lodging issues.
-
Use rates ranging from 2.5 to 6.0 lb a.i. (0.5 to 1.2 gallons per acre of 5 lb a.i. products). Use lower rates if rice is lower moisture.
-
FSA Certified Rice Acreage
Well, I was low on the acreage estimate. Certified acreage helped to hold NASS projections at 1.26 million acres. While it seems I had a lot of company also expecting lower, that’s just more folks in the wrong boat. My kids would tell me, “You get what you get and don’t pitch a fit.”
Counties with the most planted acreage this year are Poinsett, Lawrence, Arkansas, Lonoke, and Jefferson. Counties with the most prevented planting acres are Jackson, Lawrence, Cross, Poinsett, and Craighead.
Table 1. USDA-FSA August 2025 certified crop acreage data for rice in Arkansas.
County |
Planted Acreage |
|
Prevented Planting |
||||
|---|---|---|---|---|---|---|---|
Long-Grain |
Medium-Grain |
Total |
|
Long-Grain |
Medium-Grain |
Total |
|
|
Arkansas |
69,882 |
10,563 |
80,445 |
|
6,189 |
980 |
7,169 |
|
Ashley |
9,564 |
2,941 |
12,505 |
|
1,414 |
616 |
2,029 |
|
Chicot |
28,133 |
484 |
28,617 |
|
3,609 |
407 |
4,016 |
|
Clark |
2,218 |
0 |
2,218 |
|
323 |
480 |
803 |
|
Clay |
59.918 |
3,166 |
62,084 |
|
13,813 |
5,697 |
19,509 |
|
Conway |
1,493 |
0 |
1,493 |
|
876 |
0 |
876 |
|
Craighead |
42,096 |
4,624 |
46,720 |
|
22,025 |
16,319 |
38,344 |
|
Crittenden |
44,853 |
1,889 |
46,741 |
|
10,180 |
4,348 |
14,529 |
|
Cross |
65,512 |
5,336 |
70,849 |
|
11,159 |
28,113 |
39,273 |
|
Desha |
35,141 |
0 |
35,141 |
|
1,817 |
211 |
2,028 |
|
Drew |
12,173 |
0 |
12,173 |
|
1,713 |
651 |
2,364 |
|
Faulkner |
1,705 |
0 |
1,705 |
|
2,450 |
0 |
2,450 |
|
Franklin |
75 |
0 |
75 |
|
0 |
0 |
0 |
|
Greene |
59,853 |
2,415 |
62,269 |
|
17,296 |
5,785 |
23,081 |
|
Hot Spring |
675 |
0 |
675 |
|
0 |
0 |
0 |
|
Independence |
7,533 |
50 |
7,583 |
|
4,315 |
3,896 |
8,211 |
|
Jackson |
60,368 |
6,988 |
67,356 |
|
19,657 |
63,268 |
82,925 |
|
Jefferson |
67,037 |
5,146 |
72,183 |
|
10,843 |
1,908 |
12,751 |
|
Lafayette |
5,413 |
0 |
5,413 |
|
446 |
0 |
446 |
|
Lawrence |
72,757 |
8,777 |
81,534 |
|
24,724 |
30,951 |
55,675 |
|
Lee |
17,742 |
231 |
17,973 |
|
4,206 |
3,158 |
7,364 |
|
Lincoln |
25,128 |
1,467 |
26,595 |
|
2,281 |
2,587 |
4,868 |
|
Little River |
460 |
179 |
640 |
|
0 |
477 |
477 |
|
Logan |
417 |
0 |
417 |
|
0 |
0 |
0 |
|
Lonoke |
73,269 |
5,240 |
78,509 |
|
17,073 |
7,637 |
24,709 |
|
Miller |
9,145 |
0 |
9,145 |
|
1,910 |
0 |
1,910 |
|
Mississippi |
67,825 |
519 |
68,344 |
|
3,355 |
390 |
3,745 |
|
Monroe |
37,546 |
1,356 |
38,902 |
|
16,231 |
15,422 |
31,652 |
|
Perry |
1,329 |
0 |
1,329 |
|
634 |
0 |
634 |
|
Phillips |
29,716 |
424 |
30,140 |
|
6,495 |
1,129 |
7,624 |
|
Poinsett |
86,075 |
8,234 |
94,309 |
|
19,202 |
19,698 |
38,900 |
|
Pope |
2,872 |
0 |
2,872 |
|
807 |
0 |
807 |
|
Prairie |
51,235 |
2,463 |
53,698 |
|
9,557 |
3,607 |
13,164 |
|
Pulaski |
4,323 |
0 |
4,323 |
|
258 |
228 |
486 |
|
Randolph |
19,532 |
8,099 |
27,631 |
|
12,964 |
8,554 |
21,518 |
|
St. Francis |
32,766 |
1,883 |
34,649 |
|
8,198 |
2,365 |
10,563 |
|
White |
7,475 |
11 |
7,486 |
|
4,547 |
492 |
5,039 |
|
Woodruff |
48,495 |
1,507 |
50,002 |
|
15,556 |
13,400 |
28,956 |
|
Yell |
276 |
0 |
276 |
|
795 |
0 |
795 |
|
TOTALS |
1,161,026 |
83,992 |
1,245,018 |
|
276,918 |
242,774 |
519,691 |
Table 2. 2025 U.S. Rice Acres.
Planted Acres* Reported to Farm Service Agency. |
|||
|---|---|---|---|
unit: (1000) acres |
Long-grain |
Medium-Grain |
Short-Grain |
|
Arkansas |
1,161,026 |
83,365 |
627 |
|
California |
7,278 |
491,336 |
1,934 |
|
Louisiana |
413,815 |
59,044 |
-- |
|
Mississippi |
154,708 |
2,972 |
-- |
|
Missouri |
204,286 |
3,632 |
-- |
|
Texas |
137,386 |
3,823 |
-- |
|
|
|
|
|
|
U.S. Total |
2,078,499 |
644,171 |
2,560 |
|
* Planted Acres do not include Failed Acres or Prevented Planting. Source: USDA Farm Service Agency, August 2025. |
|||
Market Update
Scott Stiles
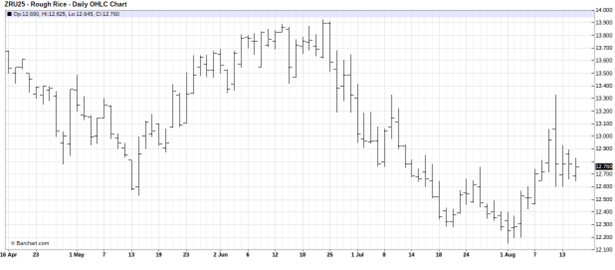
USDA Report Week! Tuesday offered a lot to digest with USDA releasing its monthly WASDE, Crop Production and FSA certified acres. September rice futures traded in a wide 73 cent range Tuesday, finding support at $12.60 and resistance at the July 9th high at $13.33. None of the USDA reports were particularly friendly to the market. New crop ending stocks got a little heavier this month on larger carry-in and NASS finding a few more acres of long-grain in the Midsouth.
Fig. 5. CME September 2025 Rice Futures, Daily Chart.
USDA made old crop and new crop adjustments this month to the U.S. long-grain balance sheet. Old crop, 2024/25 exports were reduced by 3 million hundredweight (cwt.) to 60.5 million. This flowed directly to the new crop balance sheet, increasing beginning stocks to 39.8 million cwt.
In addition, new crop production was increased by 1.7 million cwt. to 154.5 million as NASS increased its estimate of Midsouth harvested area by 52,000 acres. Another 10,000 acres were added to Arkansas’ total, 28,000 to Mississippi and 19,000 to Missouri. Louisiana’s harvested acres were reduced by 5,000.
We should note that NASS’ Crop Production report this month included the comments: “NASS reviewed planted and harvested acreage estimates in this report using all available data, including the latest certified acreage from the Farm Service Agency (FSA). All States in the estimating program for these crops were subject to review and updating.” This is a change from the USDA’s previous handling of acreage in the August Crop Production report. In past years, FSA and NASS acreage were not reconciled until later in the crop year, generally September or October.
Imports were reduced by 1 million this month, but remained record large at 43 million cwt. The net change to total supply was an increase of 3.7 million cwt. to a record 237.3 million cwt. However, much of the supply increase was offset by a 3 million cwt. increase in total demand (+2 million in domestic use, +1 million in exports).
The 2025/26 ending stocks increased by 0.7 million to 35.3 million cwt., down 4.5 million from 2024/25. The forecast for the 2025/26 marketing year average farm price was unchanged this month at $13.00/cwt or $5.85 per bushel. Given this price outlook, the projected PLC payment rate would be $1.76 per bushel for the 2025 crop. USDA current outlook for 2025 PLC payment rates can be found at this link: https://www.fsa.usda.gov/documents/2025-plc-pdf
Table 3. U.S. Long-Grain Supply and Demand.
2025/26 |
monthly change |
|||
|---|---|---|---|---|
unit: million cwt. |
2024/25 |
July |
August |
|
|
Beginning Stocks |
19.3 |
36.8 |
39.80 |
3.0 |
|
Production |
172 |
152.8 |
154.5 |
1.7 |
|
Imports |
42 |
44.0 |
43.0 |
(1.0) |
|
Total Supply |
233.3 |
233.6 |
237.3 |
3.7 |
|
Domestic Use |
133 |
133.0 |
135 |
2.0 |
|
Exports |
60.5 |
66.0 |
67 |
1.0 |
|
Total Use |
193.5 |
199.0 |
202.0 |
3.0 |
|
Carry-Over |
39.8 |
34.6 |
35.3 |
0.7 |
|
stocks-use % |
20.6% |
17.4% |
17.5% |
|
|
Avg. Producer Price ($/cwt.) |
$ 14.10 |
$ 13.00 |
$ 13.00 |
$ - |
|
Avg. Producer Price ($/bu.) |
$ 6.35 |
$ 5.85 |
$ 5.85 |
$ - |
|
PLC Reference Price ($/bu.) |
$ 6.30 |
$ 7.61 |
$ 7.61 |
$ - |
|
Proj. PLC Payment Rate ($/bu.) |
$ - |
$ 1.76 |
$ 1.76 |
$ - |
The next USDA WASDE will be released September 12th. It will include actual in-field surveys/assessments of crop yields.
Links to August 12 USDA reports:
USDA August 2025 WASDE https://www.usda.gov/oce/commodity/wasde/wasde0825.pdf
USDA NASS Crop Production https://usda.library.cornell.edu/concern/publications/tm70mv177
USDA FSA Crop Acreage Data https://www.fsa.usda.gov/tools/informational/freedom-information-act-foia/electronic-reading-room/frequently-requested/crop-acreage-data
U.S. Rice Harvest
U.S. rice harvest continues to be on par with last year and the 5-year average. Harvest in Texas was 36% complete as of August 10th. Louisiana has reached the halfway mark. Arkansas’ rice harvest was progressing northward in the state this week. Cash bids for spot delivery to driers have been in the $5.34 to $5.41 per bushel range this week in eastern Arkansas. Mill bids have been around $5.48/bu. Basis at most locations softened 2 cents per bushel this week following a strong early week rally above $13 in September futures.
Table 4. Rice Harvested - Selected States (%).
State |
Week ending |
2020 – 2024 Average |
||
|---|---|---|---|---|
Aug. 10, 2024 |
Aug. 3, 2025 |
Aug. 10, 2025 |
||
|
|
(percent) |
(percent) |
(percent) |
(percent) |
|
Arkansas |
2 |
- |
1 |
1 |
|
California |
- |
- |
- |
- |
|
Louisiana |
50 |
27 |
49 |
45 |
|
Mississippi |
1 |
- |
3 |
- |
|
Missouri |
- |
- |
- |
- |
|
Texas |
36 |
15 |
36 |
34 |
|
|
|
|
|
|
|
6 States |
12 |
6 |
11 |
10 |
|
source: "Crop Progress” USDA NASS, August 11, 2025. |
||||
DD50 Rice Management Program is Live
The DD50 Rice Management Program is live and ready for fields to be enrolled for the 2025 season. All log-in and producer information has been retained from the 2024 season, so if you used the program last year you can log in just as you did last year. Log in and enroll fields here: https://dd50.uada.edu.
Use the Arkansas Rice Advisor Internet App!
The Arkansas Rice Advisor site https://riceadvisor.uada.edu functions like an app on your mobile device. There you can readily access the DD50 program, rice seeding rate calculator, drill calibration, fertilizer and N rate calculators, publications, and more.
Additional Information
Arkansas Rice Updates are published periodically to provide timely information and recommendations for rice production in Arkansas. If you would like to be added to this email list, please send your request to rice@uada.edu.
This information will also be posted to the Arkansas Row Crops blog (http://www.arkansas-crops.com/) where additional information from Extension specialists can be found.
More information on rice production, including access to all publications and reports, can be found at http://www.uaex.uada.edu/rice.
Acknowledgements
We sincerely appreciate the support for this publication provided by the rice farmers of Arkansas and administered by the Arkansas Rice Research and Promotion Board.
The authors greatly appreciate the feedback and contributions of all growers, county agents, consultants, and rice industry stakeholders.
Specialist |
Area |
Phone Number |
|
|---|---|---|---|
|
Jarrod Hardke |
Rice Extension Agronomist |
501-772-1714 |
|
|
Tom Barber |
Extension Weed Scientist |
501-944-0549 |
|
|
Nick Bateman |
Extension Entomologist |
870-456-8486 |
|
|
Ralph Mazzanti |
Rice Verification Coordinator |
870-659-5507 |
|
|
Camila Nicolli |
Extension Pathologist |
608-622-2734 |
|
|
Trent Roberts |
Extension Soil Fertility |
479-935-6546 |
|
|
Bob Scott |
Extension Weed Scientist |
501-837-0273 |