Arkansas Soybean Cash and Booking Market Reports - May 24, 2024
This report is a weekly newsletter summarizing cash market and forward price quotes from selected markets as reported to the USDA Agricultural Marketing Service in Arkansas.
Soybean Cash Market Statistics and Elevator Prices
The Arkansas soybean cash market posted a 20 cent gain over the weekend to open at $12.22 on Monday. The statewide average traded lower during the week to close on Thursday at $12.15 (Figure 1). The USDA-AMS did not publish a market report on Friday. Thursday’s average price was 13 cents above the previous week’s closing average price. This week’s average daily price range (maximum - minimum) was 57 cents. Ten market location provided price quotes during the week (Figure 2).
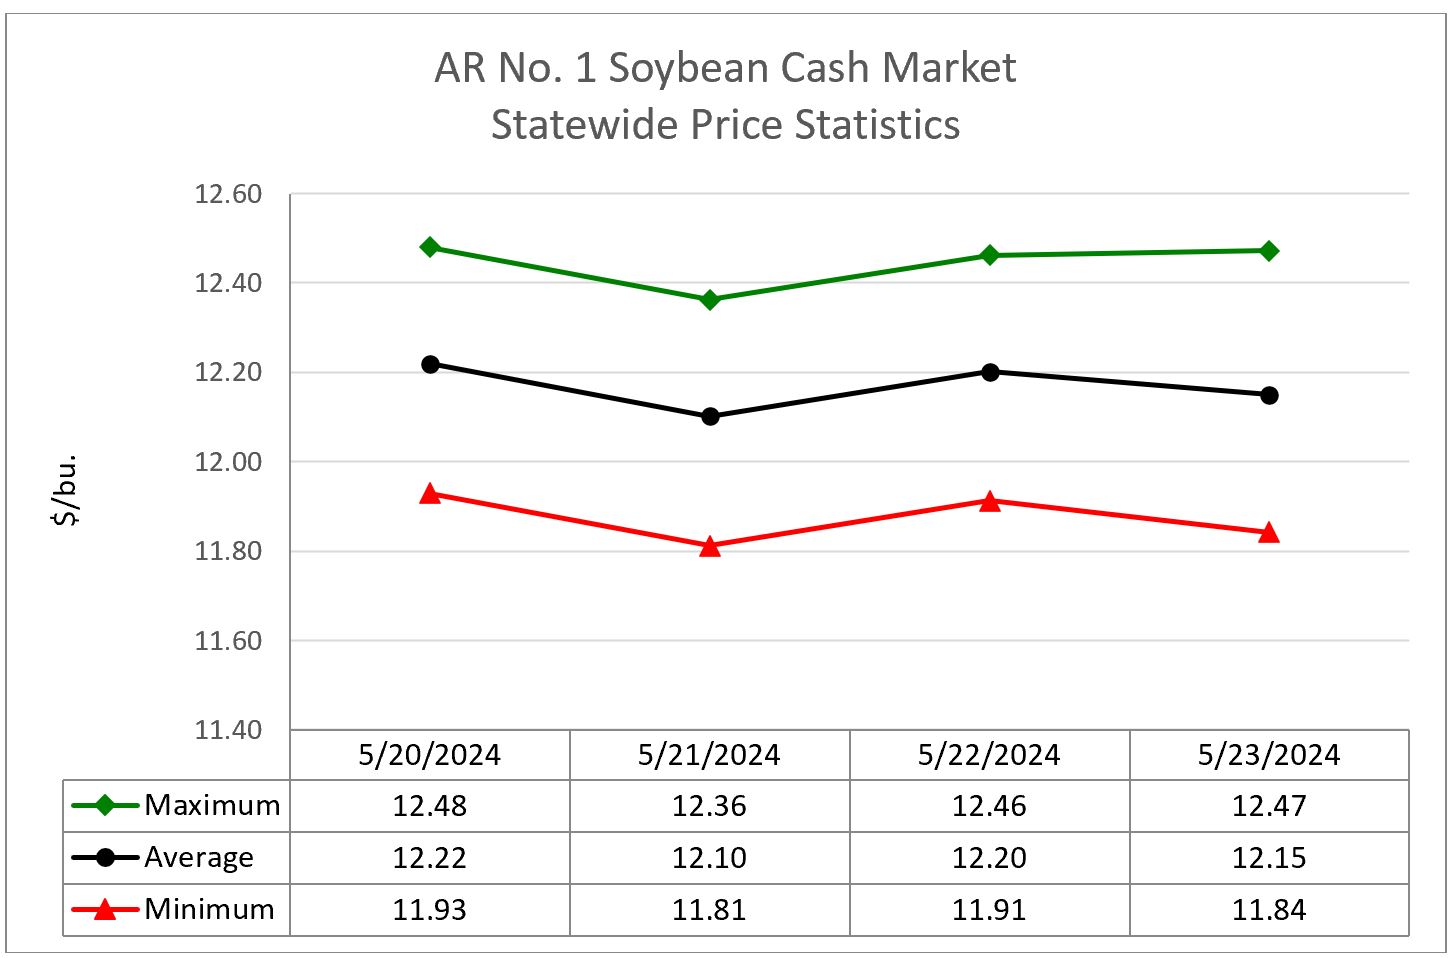 Figure 1. Soybean Cash Market Statistics
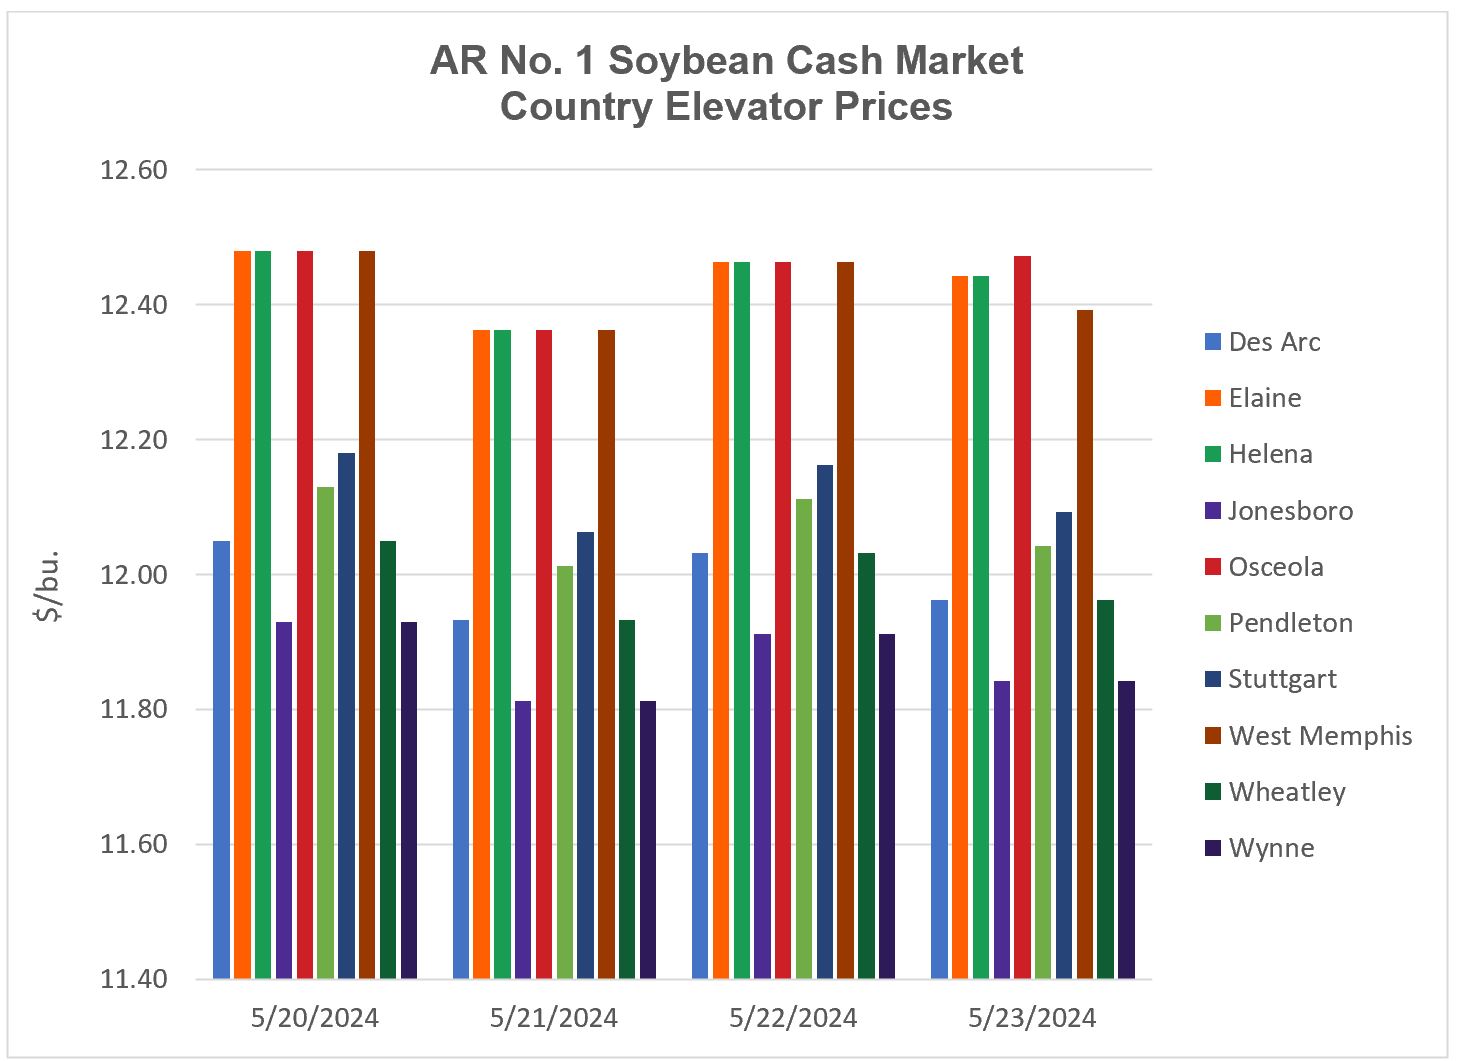
Figure 2. Soybean Cash Market Elevator Prices
Table 1. Soybean Cash Market Elevator Prices
|
Location |
May 20 |
May 21 |
May 22 |
May 23 |
May 24 |
|---|---|---|---|---|---|
|
Des Arc |
12.05 |
11.93 |
12.03 |
11.96 |
|
|
Elaine |
12.48 |
12.36 |
12.46 |
12.44 |
|
|
Helena |
12.48 |
12.36 |
12.46 |
12.44 |
|
|
Jonesboro |
11.93 |
11.81 |
11.91 |
11.84 |
|
|
North Little Rock |
|
|
|
|
|
|
Osceola |
12.48 |
12.36 |
12.46 |
12.47 |
|
|
Pendleton |
12.13 |
12.01 |
12.11 |
12.04 |
|
|
Stuttgart |
12.18 |
12.06 |
12.16 |
12.09 |
|
|
West Memphis |
12.48 |
12.36 |
12.46 |
12.39 |
|
|
Wheatley |
12.05 |
11.93 |
12.03 |
11.96 |
|
|
Wynne |
11.93 |
11.81 |
11.91 |
11.84 |
|
Soybean 2024 October - January Booking Market Statistics and Elevator Prices
This week, the booking market average posted a 14 cent gain over the weekend to open at $11.82 on Monday. The statewide average traded sideways during the week to close on Thursday at $11.82 (Figure 3). The USDA-AMS did not publish a market report on Friday. Thursday’s average price was 14 cents above the previous week’s closing average price. This week’s average daily price range (maximum - minimum) was 61 cents. Ten market locations across the state provided price quotes throughout week (Figure 4).
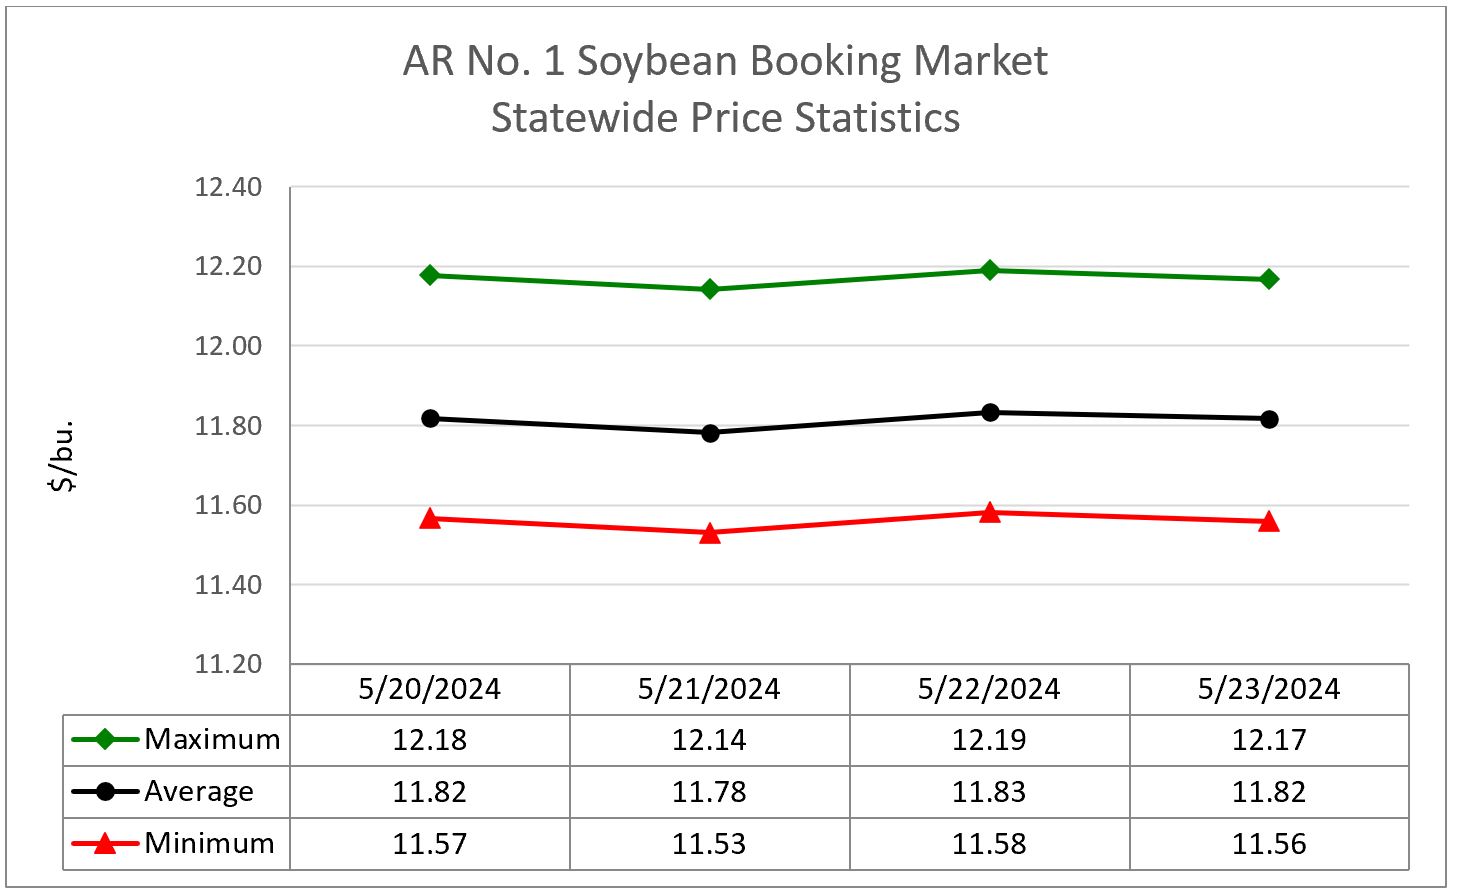 Figure 3. Soybean 2024 October - January Booking Market Statistics
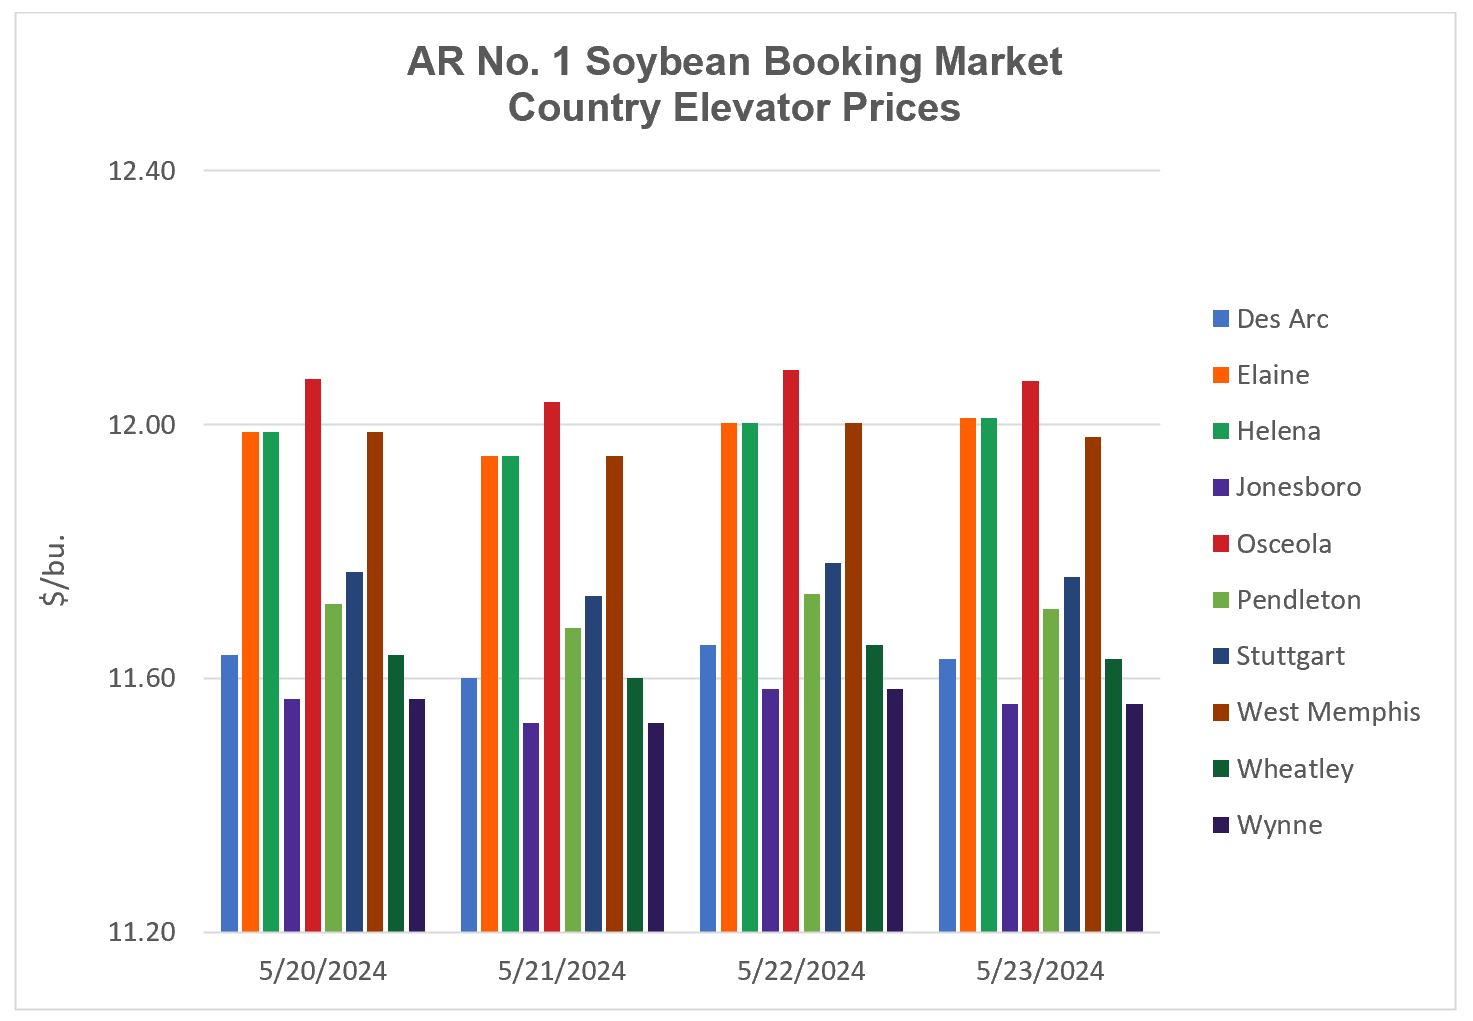
Figure 4. Soybean 2024 October - January Booking Market Elevator Prices
Table 2. Soybean 2024 October - January Booking Market Elevator Prices
|
Location |
May 20 |
May 21 |
May 22 |
May 23 |
May 24 |
|---|---|---|---|---|---|
|
Des Arc |
11.64 |
11.60 |
11.65 |
11.63 |
|
|
Elaine |
11.99 |
11.95 |
12.00 |
12.01 |
|
|
Helena |
11.99 |
11.95 |
12.00 |
12.01 |
|
|
Jonesboro |
11.57 |
11.53 |
11.58 |
11.56 |
|
|
North Little Rock |
|
|
|
|
|
|
Osceola |
12.07 |
12.04 |
12.09 |
12.07 |
|
|
Pendleton |
11.72 |
11.68 |
11.73 |
11.71 |
|
|
Stuttgart |
11.77 |
11.73 |
11.78 |
11.76 |
|
|
West Memphis |
11.99 |
11.95 |
12.00 |
11.98 |
|
|
Wheatley |
11.64 |
11.60 |
11.65 |
11.63 |
|
|
Wynne |
11.57 |
11.53 |
11.58 |
11.56 |
|
(Market average prices stated in this report are unweighted averages of the state markets surveyed by USDA-AMS. Price data is based on the Arkansas Daily Grain Bids Report.)