Is there value in automatic fungicide application in soybean?
Key points:
- Fungicide applications are one important tool in an integrated approach for effectively managing foliar diseases in soybean.
- In 2025, frogeye leaf spot was moderate to severe in 7 trials and fungicide application was profitable in 5 of the 7.
- Data from 53 on-farm fungicide trials conducted from 2020-2025 suggests an automatic fungicide application, without consideration of fungicide mode of action or disease presence, resulted in a 3.3 bushel per acre yield increase, roughly break even or just above, given the estimated cost of most applications ($30).
- Evidence suggests fungicide applications in the absence of disease do not consistently add value to the crop above the cost of product and application.
- When available, planting high yielding, disease resistant varieties are the best line of defense against commonly occurring foliar diseases like frogeye leaf spot.
Since 2020, the Arkansas Soybean Promotion Board has funded a project with the objective of determining the value of fungicide application on soybean using large plot on-farm trials. To date we have completed around 60 trials (53 with yield data) spanning northeast Arkansas to far southeast Arkansas. Each trial is designed similarly, where there are two to three fungicide treatments and a nontreated control, replicated three times, and the treatments are arranged in a randomized complete block design, where each replication has all fungicide treatments and a nontreated included. The plots for each treatment are typically 60 – 120 ft wide and run the full length of the field. Trial sizes vary but are generally in the 20-to-30-acre range. Fungicide treatments were applied at R3 in most trials using a ground sprayer equipped with a 30-ft boom, and in a total water volume of 10 gal/acre. Depending on the length of the plots, disease levels were determined at three to five points within each plot at the time fungicide application and again at R5.5 (pod fill) - R6 (full seed). Grain was harvested with the local farmer’s combine and either yield monitor data was recorded, or a weigh wagon was used to determine yields within each plot. Yields were adjusted to 13% moisture by volume. If yield was collected from the yield monitor, it was buffered by plot boundaries and the field boundaries and averaged within each plot. Data was subjected to analysis of variance (ANOVA) followed by means separation of fixed effects when appropriate. The reports from each trial were made available to the cooperating producer, county agent, and industry cooperators and published in each county’s annual demonstration booklet.
In 2025, frogeye leaf spot was moderate to severe in 7 of our 10 trial locations and at least one fungicide application was profitable, yields greater than 3 bu/A when compared to the nontreated, in 5 of the 7 (Table 1). It certainly was a ‘frogeye year’ and there may have been more severe frogeye in 2025 than I have seen in a decade. There were also moderate levels of brown spot in the trials at Lincoln and Jefferson County, and it likely contributed to yield losses in those two trials. However, it was most likely not severe enough to cause losses in the other six where it was found and rated. Typically, brown spot occurs in the lower canopy of most soybean fields in Arkansas and does not impact yield. When it is active in the upper third of the canopy during the reproductive stages, it can cause yield loss.
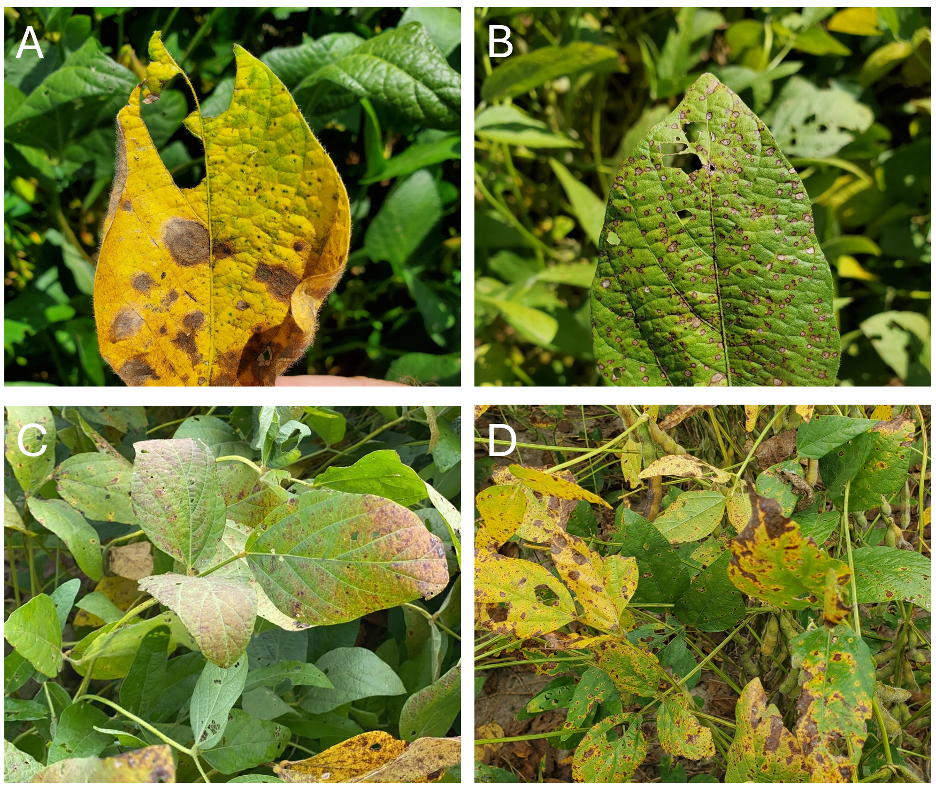
Figure 1. Examples of some of the foliar diseases rated in the trials and the causal fungus. A. Target leaf spot, Corynespora cassiicola B. Frogeye leaf spot, Cercospora sojina, C. Cercospora leaf blight, Cercospora spp., and D. Brown spot, Septoria glycines.
The trials in 2025 were representative of what we have seen in most years. There are normally a handful of locations with significant disease, and others with lower levels of disease. To summarize, frogeye leaf spot was observed at 10 locations, target spot at 3 locations, brown spot at 8 locations, and Cercospora leaf blight at 9 locations. An example of each of those diseases is shown in Figure 1. Overall, some fungicide treatments were profitable while others were not. Why? Simply finding disease doesn’t necessarily mean an application is needed (see brown spot low in the canopy). Put simply, disease severity is determined by what we refer to as the disease triangle; the host being susceptible to disease, the pathogen being present, and the environment being conducive for one or more diseases to develop. At some locations the soybean variety was susceptible, and the environment was conducive for disease to develop and spread. In others, neither was true. In many fields, we can find several diseases of varying severities. The variety isn’t always susceptible to any one (or more) of those diseases and/or the environment isn’t conducive to significant development of disease. When this occurred in our trials, fungicide applications weren’t profitable. This was true in 2025 and across other trial years as well.
Table 1. Fungicide trial location and products applied, 2025.
|
a Northrup-King NK43W1XFS, Northrup-King NK49C2XFS, (NK Seeds, Greensboro, NC), Asgrow AG45XF3, Asgrow AG46XF3, Asgrow Seed Company, (Creve Coeur, MO), Pioneer P43Z44SE, Pioneer P45Z75E, Pioneer P46A90LX, Pioneer P53Z60LX, (Pioneer Seeds, Johnston, IA), Armor A46-D09, (Armor Seed, Jonesboro, AR) bLongitude, latitude in geographic coordinate system ‘WGS 1984’ in decimal degrees (approximate to field center). cYields were adjusted to 13% moisture content for comparison and are reported as bushels per acre (bu/A). Harvest data was provided from weigh wagons or yield monitors located on the cooperating farmers’ combines. Data were subjected to analysis of variance. Significance of response levels are symbolized by * = 0.05, ** = 0.01, and *** < 0.0001. Yield data was not available for the ‘Chicot’ location. dYield difference when the yield of the nontreated control is subtracted from the treatment yield at each trial location. |
|||||||
|
Trial |
Variety a |
Locationb |
Trial Yield (bu/A) c |
Treatments |
Rate applied |
Treatment Yields (bu/A) |
Difference from Nontreated (bu/A) d |
|---|---|---|---|---|---|---|---|
|
Arkansas |
NK43W1XFS |
34.5620, -91.5067 |
74.6 |
Miravis Top 1.67 SC |
13.7 |
74.7 |
0.2 |
|
Revylok 3.33 SC |
5.5 |
74.7 |
0.2 |
||||
|
Arkansas/Jefferson |
NK49C2XFS |
34.4259, -91.6820 |
83.4*** |
Miravis Top 1.67 SC |
13.7 |
93.8 |
43.3 |
|
Domark 230 ME |
5.0 |
69.6 |
19.1 |
||||
|
Biohealth (biological) |
32.0 |
57.4 |
6.9 |
||||
|
Ashley |
AG46XF3 |
33.2799, -91.6816 |
58.3 |
Miravis Top 1.67 SC |
13.7 |
53.8 |
0.3 |
|
Biohealth (biological) |
32.0 |
49.9 |
-3.6 |
||||
|
Radius ESQ 3.76 SC |
7.5 |
53.6 |
0.1 |
||||
|
Ashley 2 |
AG46XF3 |
34.5475, -91.5056 |
52.7 |
Miravis Top 1.67 SC |
13.7 |
60.6 |
2.1 |
|
Domark 230 ME |
5.0 |
55.6 |
-2.9 |
||||
|
Chicot |
P45Z75 |
33.1834, - 91.2199 |
--- |
Miravis Top 1.67 SC |
13.7 |
--- |
--- |
|
Domark 230 ME |
5.0 |
--- |
--- |
||||
|
Drew |
A46D09 |
33.7537, -91.4535 |
69.7 |
Miravis Top 1.67 SC |
13.7 |
68.3 |
-2 |
|
Domark 230 ME |
5.0 |
70.4 |
0.1 |
||||
|
Jefferson |
AG45XF3 |
34.2315, -91.6927 |
82.3** |
Miravis Top 1.67 SC |
13.7 |
87.3 |
16.2 |
|
Domark 230 ME |
5.0 |
84.2 |
13.1 |
||||
|
Revylok 3.33 SC |
5.5 |
86.6 |
15.5 |
||||
|
Lincoln |
P43Z44SE |
33.9179, -91.7219 |
65.7** |
Miravis Top 1.67 SC |
13.7 |
68.6 |
4.7 |
|
Domark 230 ME |
5.0 |
64.6 |
0.7 |
||||
|
Lonoke |
P53Z60LX |
34.7530, -91.9795 |
68.8* |
Miravis Top 1.67 SC |
13.7 |
75.3 |
12.8 |
|
Domark 230 ME |
5.0 |
68.6 |
6.1 |
||||
|
White |
P46A90LX
|
35.1059, -91.6873 |
60.7* |
Miravis Top 1.67 SC |
13.7 |
64.8 |
6.6 |
|
Biohealth (biological) |
32.0 |
59.2 |
1 |
||||
Looking across all six years of on-farm trial data, 2020 – 2025, fungicide application resulted in a 3.3 bushel per acre (bu/A) increase above the nontreated. Products containing a FRAC group 11 mode of action had an average yield above the nontreated of 2.5 bu/A, and those that did not contain a FRAC group 11 mode of action, 3.5 bu/A above the nontreated (Table 2.). That one-bushel lag between the two groups is important because frogeye leaf spot has been shown to be resistant to fungicides within FRAC group 11, otherwise known as Quinone Outside Inhibitors (QoIs) or strobilurins. There is evidence that other commonly occurring soybean diseases, like target spot, are as well. Based on these data, products containing Group 11 fungicides are effective at controlling diseases like aerial blight (Figure 2) but may not be the best product choices for other soybean diseases. This is something to keep in mind when choosing a fungicide to apply. For information on fungicide options, please consult the 2026 Arkansas Plant Disease Control Products Guide - MP154 https://www.uaex.uada.edu/publications/mp-154.aspx.
Outside of a few trials, applications were made at R3 to simulate the automatic fungicide application timing that many are doing. In trials where moderate to severe disease developed after application, one or more products often paid for themselves, or said another way, added value to the soybean crop above the estimated cost of application. Using 3 bu/A as a break-even, that occurred in about 40% of treatments overall, 42% in those without a Group 11 and 35% in those with a Group 11.
Table 2. Summary of trials completed in commercial fields comparing fungicides that do not contain Group 11 modes of action to fungicides containing Group 11 modes of action. The reported yield is the treatment relative to the nontreated control in each trial (Example: fungicide treatment yield – nontreated yield = reported result).
|
Trial years |
Fungicide a |
Yield (bu/A) b |
Yield range (bu/A) c |
> 3 bu/Ad |
Total e |
|---|---|---|---|---|---|
|
2020 - 2025 |
No Group 11 |
3.5 |
-4.0 - 43.3 |
33 |
79 |
|
|
With Group 11 |
2.5 |
-3.2 - 12.1 |
9 |
26 |
a The Fungicide Resistance Action Committee (FRAC) categorizes fungicides by mode of action. Those represented in the trial are: Demethylation Inhibitors (DMI, group 3), Succinate Dehydrogenase Inhibitors (SDHI, group 7), and Quinone Outside Inhibitors (QoIs, group 11). Miravis Top (13.7 fl oz/A, FRAC 3 & 7), was the standard fungicide treatment included in all 53 trial locations. Fungicides containing a Group 11 mode of action were Revytek (22 trials, 8.0 fl oz/A, FRAC 11, 3 & 7), Trivapro (2 trials, 13.7 fl oz/A, FRAC 11, 3 & 7), Priaxor + Tilt (1 trial, 4 fl oz/A & 4.0 fl oz/A, FRAC 11, 3 & 7), Quadris Top SBX (1 trial, 7.0 fl oz/A, FRAC 11, & 3) and Radius ESQ (1 trial, 7.0 fl oz/A, FRAC 11, & 3). Fungicides applied that did not contain a Group 11 mode of action (excluding the standard treatment) were Lucento (11 trials, 5.5 fl oz/A, FRAC 3 & 7), Revylok (10 trials, 6.5 fl oz/A, FRAC 3 & 7), and Domark (5 trials, 5.0 fl oz/A, FRAC 3). b Yield data reported in bushels per acre (bu/A) and is relative to the nontreated control. c The range of treatment yields relative to the nontreated in each trial and based on the two categories. d The number of treatments where the yield relative to the nontreated was above 3 bushels per acre, the estimated break-even considering cost of application. e The number of fungicide treatments included from 2020 to 2025.
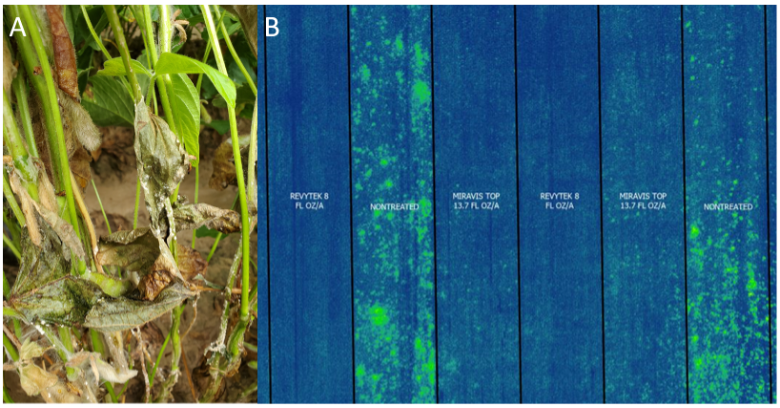
Figure 2. Aerial blight on soybean, caused by the fungus Rhizoctonia solani AG 1-IA (A) and an aerial image of a fungicide trial completed in 2022 in Drew County where aerial blight was severe (not all plots shown). A normalized difference vegetation index (NDVI) was calculated and the color scheme set to color healthy soybeans blue and patches of aerial blight green. There is good control provided by both fungicides in the trial, Miravis Top (13.7 fl oz/A , FRAC 3 & 7) and Revytek (8 fl oz/A, FRAC 11, 3 & 7) when compared to the nontreated.
Below, Figure 3 gives a visual representation of the distribution of the results around the 3 bushel per acre “break-even” line. There are several data points below that line, and the key finding is that many applications resulted in a net loss relative to the estimated cost of application. Again, the trials with data points below that line didn’t have much disease. Not none, but very little, or it was late to develop. This shows the importance of scouting and then deciding on fungicide application based on the disease that is found, how much is there, the pace with which it is spreading in the field, and the growth stage relative to disease development (earlier occurring disease is typically more impactful). Taking into consideration the current weather conditions, and those forecasted, can also help to determine if an application would most likely be needed. Recently, a predictive model for frogeye leaf spot has been developed. This model can help to determine when environmental conditions are conducive for disease development and more intensive scouting of soybean fields may be needed. The model can be found at https://cropprotectionnetwork.org/crop-disease-forecasting.
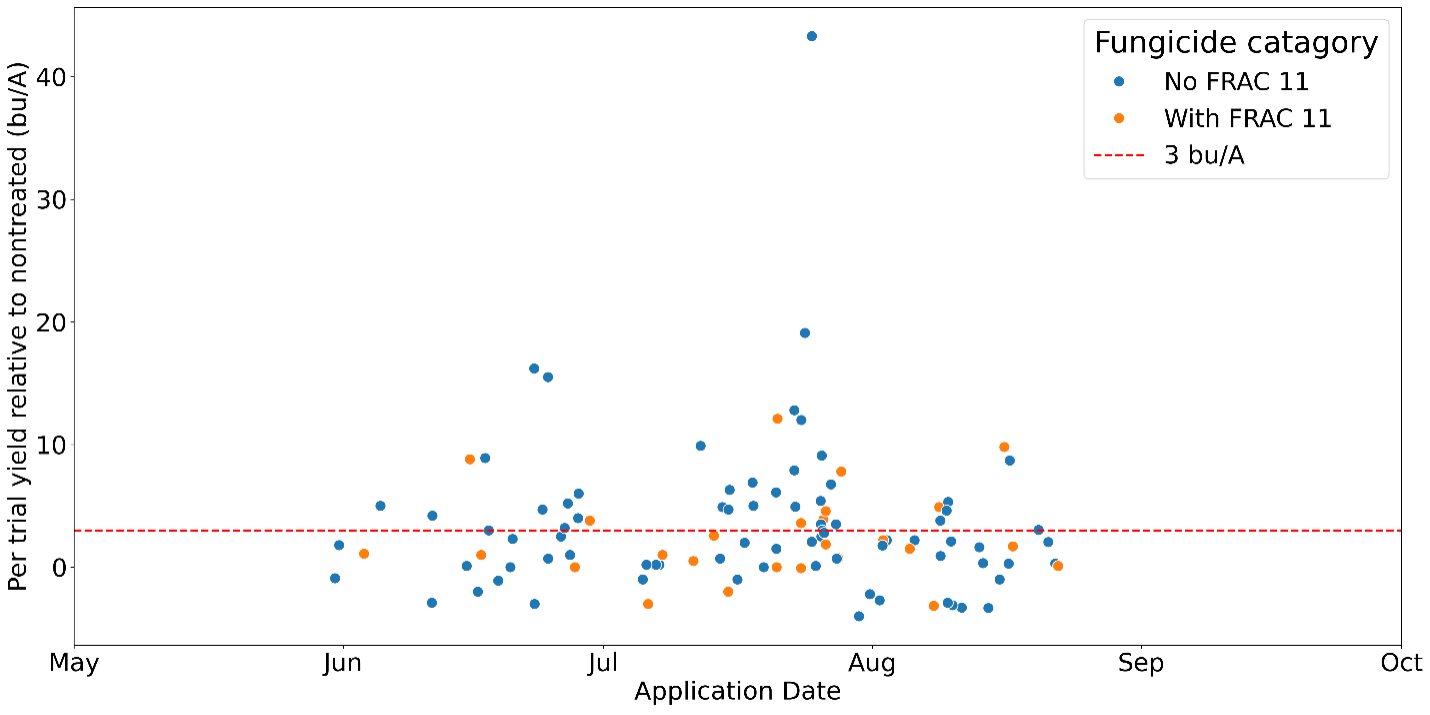
Figure 3. A time-series chart showing the date of application and yield of fungicides applied relative to the nontreated control that was included in each trial. Most fungicide applications were made at R3, to represent the most popular timing for automatic (preventative) applications. The fungicide treatments applied are separated into two categories, those that do not contain a FRAC Group 11 fungicide or those that do.
The take home message here is a simple one. Based on these data, automatic fungicide applications in the absence of significant disease were profitable less than half of the time, and only if significant disease developed after application. Fungicides that only have modes of action in FRAC group 3 and 7 were more effective overall than those that contain a FRAC group 11 mode of action, likely due to the development of fungicide resistance (frogeye and possibly others). Repeated scouting and then deciding on fungicide application (or not) based on what is seen, is the best way to ensure an application is profitable and protects yield above the cost of the product and application.
We thank the Arkansas Soybean Promotion Board for funding this project. We also thank the many producers, crop consultants, and county agents for collaborating with us to successfully complete these trials.