Arkansas Rice Update 8-26-22

Arkansas Rice Update 2022-22
August 26, 2022
Jarrod Hardke, Scott Stiles, and Tommy Butts
“What goes up must come down, spinning wheel got to go ‘round.”

A Slow Burn
Jarrod Hardke
Early harvest progress is still extremely limited even as draining progress has really picked up over the last two weeks. Good yield reports continue from those finding rice dry enough to cut. No signs of big home runs, but so far comments have been plenty positive.
Unfortunately, moderate temperatures and cloudy conditions are leading to extremely high humidity (~95% in the mornings) and letting heavy dew hang around longer in the day. This seems to be dragging out rice maturity and refusing to let grain moisture drop down.
By this time next week, after some small rain chances, humidity is supposed to drop out and may finally point us toward better grain maturity as we head into Labor Day. Heavy dew set once grain is mature typically isn’t good for milling yields. However, it’s most negative when we get extreme wetting followed by extreme drying. That hasn’t really been the case lately, so hopefully the wetting of kernels right now isn’t too much to be concerned with.
There are talks of potential gulf weather activity on the horizon, but that’s still a ways out and anyone’s guess where it may end up headed if it does happen.
Lots of information on the FSA Acreage report is below in the Rice Market Update.
Let us know if we can help.
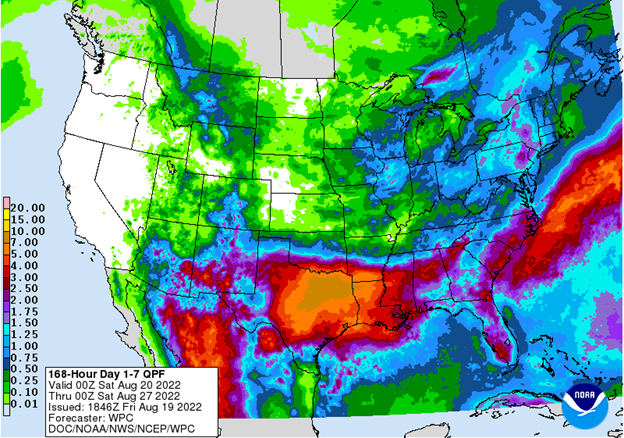
Fig. 1. NOAA 7-day precipitation forecast.
Pre-Harvest Weed Cleanup
Jarrod Hardke and Tommy Butts
Extended hot and dry conditions for most of this summer, especially around flooding, led to less effective herbicide weed control for most of the season. This excessive heat and drought also made water management more difficult and allowed for weeds to emerge later into the season in areas where we thought we were clear. We’re now seeing a fair amount of late weeds that broke through the canopy around heading, and as harvest nears, there are questions about what, if anything, we can do about them. Unfortunately, the answer is not much.
If we’re talking grasses, there is nothing to be done. Any application will be a waste (ineffective and uneconomical), and off-label.
Weedy rice has seemingly exploded across the state this year. It tends to always be a scourge in drought years, and it reappeared in fields this year where it had seemingly been eradicated from long ago (weed seed dormancy and viability are killers). When it comes to weed rice control this time of year, a harvest aid application of sodium chlorate (salt) might slightly help more of it shatter so it doesn’t end up in the combine, but that’s no guarantee; in fact, it is likely a low probability. Also, since we recommend beginning harvest within a few days after a salt application, there isn’t much time for it to work.
Hemp sesbania and jointvetch (indigo) clearly liked the wetting and drying conditions experienced in many fields. A pre-harvest application of Aim (carfentrazone) or salt may help to desiccate the plants and possibly* pop seed, but results will be questionable and more often than not, a failure. The more mature the plants are, the more likely these applications could provide some benefit; however, this will likely only occur with our later harvested rice fields.
The safest and most economical bet is to probably roll with what’s there. If areas are extreme to the extent you’re worried about dockage, consider separating those areas into their own lot at harvest so only that lot is docked rather than possibly contaminating a larger lot and receiving a greater reduction in grade.
Unfortunately, this is essentially all of the options that exist out there, and none are great or even good. We’ve spent plenty of money this year, so we probably shouldn’t chase after some of these problems. Sometimes the fastest way to double your money is to fold it in half and put it back in your pocket.
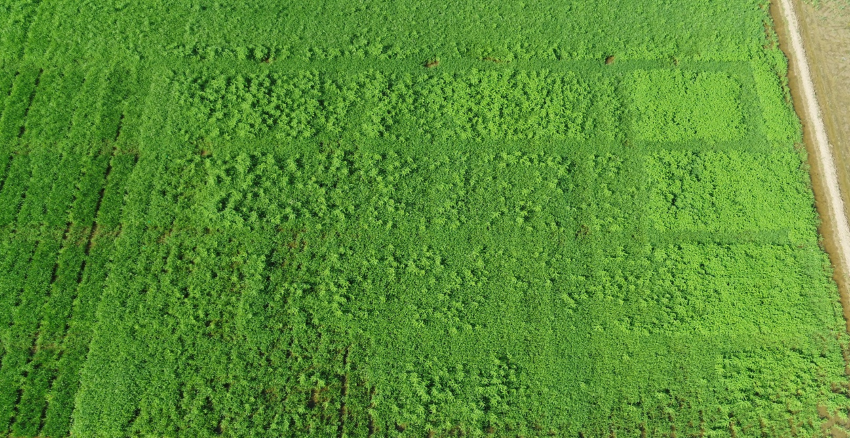
Fig. 2. Coffeebean post-flood.
Rice Market Update
Scott Stiles
This week we’ll shift our attention to November rice futures. Over the past week, open interest has been evaporating fast in the September contract. This exit is typical in the few weeks ahead of First Notice Day. For the September contract, First Notice Day is next Wednesday, August 31st. To avoid taking physical delivery of a commodity, a trader needs to be out of a long (buy) position by the close of the day prior to First Notice Day.
It’s interesting to compare the price trends in the September and November contracts over the past 90 days. In the graph below, the top, red line represents the November contract and the bottom, black line is the September contract. The vertical distance between these two lines is typically referred to as the “spread” or some use the term “carry”.
Fig. 3. CME Rough Rice Futures, Sept. 2022 and Nov. 2022, Three-month daily chart.
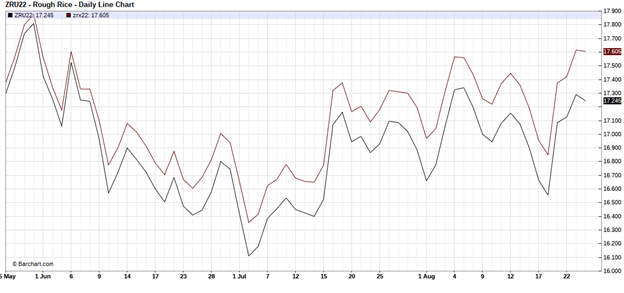
Note the Sept/Nov spread in late May was a narrow 7 cents. Today the spread has expanded out to 36 cents. Although not to the extent seen today in the Sept/Nov, there is “carry” in the rice futures market out to May 2023 with the May contract currently trading near $18.10. The message here is, a positive month-to-month futures spread can encourage growers to defer delivery, so long as there’s a return to storage.
The widening separation in the Sept/Nov spread reflects the monthly increases in USDA’s ending stocks projections and a market becoming more comfortable with the supply outlook. Since May, USDA’s projection for new crop long-grain ending stocks has ballooned by 5.4 million, from 18.3 to 23.7 million cwt. Practically all the increase is due to imports and old crop carry-in.
Also, with the November contract becoming the lead month, we’ve seen basis for the August to October delivery slot weaken by about 10 cents per bushel over the past week. For August to October delivery, basis at mills is around 23 cents per bushel under November futures. Mill bids Friday morning were near $7.70. Basis at driers ranged this week from 29 to 36 cents per bushel under November, with bids Friday in the $7.56 to $7.63 range. Basis for more deferred delivery is much stronger. For example, basis is currently 5 cents per bushel over futures for January to March delivery to mills and 2 cents under futures for delivery to some drier locations.
Harvest Progress:
In Monday’s Crop Progress, USDA estimated the U.S. rice harvest at 15% complete for the week ending August 21st, up from 11% the prior week. Ahead of this week’s rains, Louisiana and Texas had harvested 60 and 66% respectively. Arkansas was at 2% percent harvested and on pace with the 5-year average.
The Midsouth delta counties are expected to see low rainfall totals early next week (less than half an inch), with current model runs predicting the best rain chances Sunday thru Tuesday. Weekly rainfall totals increase into Louisiana and along the Texas gulf coast. As of Friday (8/25) there were no well-organized tropical systems moving into the Gulf of Mexico.
Table 1. Rice Harvested (%).
State |
Week ending |
2017 – 2021 avg. |
||
|---|---|---|---|---|
Aug. 21, 2022 |
Aug. 14, 2022 |
Aug. 21, 2021 |
||
|
Arkansas |
2 |
1 |
2 |
2 |
|
California |
0 |
0 |
0 |
0 |
|
Louisiana |
60 |
46 |
61 |
66 |
|
Mississippi |
0 |
0 |
2 |
4 |
|
Missouri |
0 |
0 |
0 |
0 |
|
Texas |
66 |
51 |
49 |
59 |
|
6 States |
15 |
11 |
14 |
15 |
|
Source: USDA NASS |
||||
FSA Crop Acreage:
On Monday (8/22), USDA’s Farm Service Agency released its August Crop Acreage file. As always, there is a lot to digest in this information. Focusing on Arkansas, growers have reported 993,340 planted acres of long-grain. Planted acres do not include failed acres or prevented planting. For comparison, NASS’ June forecast for Arkansas long-grain was 1.04 million harvested acres. Medium and short grain acres reported to FSA were 89,786 compared to NASS’ June forecast of 96,000 acres. Total rice acres currently stand at 1,083,125 against the NASS June forecast of 1.136 million harvested.
Table 2. 2022 Arkansas Rice Acres.
Planted Acres* Reported to Farm Service Agency and NASS Harvested Acres Forecast. |
||||
|---|---|---|---|---|
unit: acres |
FSA |
NASS |
Difference |
% Difference |
August* |
June 30 |
|||
|
Long-Grain |
993,340 |
1,040,000 |
-46,660 |
-4.5% |
|
Medium and Short Grain |
89,786 |
96,000 |
-6,214 |
-6.5% |
|
|
|
|
|
|
|
U.S. Total |
1,083,125 |
1,136,000 |
-52,875 |
-4.7% |
|
Totals may not add due to rounding. * Planted Acres do not include Failed Acres or Prevented Planting. Source: USDA Farm Service Agency and USDA NASS. |
||||
The following table includes total rice acreage by county. As of August 22, rice acreage had been certified in 40 counties. The top 20 counties grow 92% of the total acres.
Table 3. Arkansas Rice Acres* Reported to FSA, August 22, 2022.
|
|
County |
Acres |
|
County |
Acres |
|---|---|---|---|---|---|
|
1 |
Lonoke |
84,129 |
21 |
Chicot |
18,107 |
|
2 |
Jackson |
83,968 |
22 |
Lee |
12,648 |
|
3 |
Poinsett |
81,464 |
23 |
Drew |
10,267 |
|
4 |
Lawrence |
75,965 |
24 |
Independence |
8,904 |
|
5 |
Arkansas |
65,521 |
25 |
Miller |
6,216 |
|
6 |
Clay |
62,199 |
26 |
White |
6,086 |
|
7 |
Greene |
55,228 |
27 |
Lafayette |
5,439 |
|
8 |
Jefferson |
55,079 |
28 |
Pulaski |
5,226 |
|
9 |
Cross |
54,203 |
29 |
Ashley |
4,563 |
|
10 |
Prairie |
50,771 |
30 |
Clark |
3,700 |
|
11 |
Craighead |
50,276 |
31 |
Pope |
2,362 |
|
12 |
Woodruff |
46,711 |
32 |
Faulkner |
2,070 |
|
13 |
Mississippi |
42,934 |
33 |
Conway |
1,199 |
|
14 |
Monroe |
40,859 |
34 |
Perry |
903 |
|
15 |
Crittenden |
29,139 |
35 |
Hot Spring |
701 |
|
16 |
Randolph |
28,629 |
36 |
Yell |
661 |
|
17 |
St. Francis |
26,572 |
37 |
Little River |
546 |
|
18 |
Phillips |
20,866 |
38 |
Logan |
353 |
|
19 |
Lincoln |
20,060 |
39 |
Franklin |
97 |
|
20 |
Desha |
18,447 |
40 |
Johnson |
59 |
|
|
|
|
|
TOTAL |
1,083,126 |
|
* Planted acres excluding failed acres and prevented planting. |
|||||
|
source: USDA Farm Service Agency, August 2022. |
|||||
At the national level, we found it interesting that over the past five years, August “planted” acres reported to FSA, are remarkably close to NASS’ final harvested acres. Note that NASS uses FSA planted acreage data to complement their survey data.
The table below provides a comparison of NASS’ final long-grain harvested acres and August planted acres reported to FSA. In 2020, COVID-19 complicated reporting to county FSA offices, creating abnormal delays. Excluding 2020, in four of the last five years the August planted acres reported to FSA have been within roughly 2,100 acres or one-tenth of one percent (.1%) of NASS’ final harvested acres.
Table 4. U.S. Long-Grain Rice Acres, 2017-2021.
|
|
NASS |
FSA |
Difference |
% Difference |
|---|---|---|---|---|
|
|
final harvested acres |
August* |
|
|
|
2017 |
1,748,000 |
1,746,342 |
(1,658) |
-0.1% |
|
2018 |
2,176,000 |
2,173,071 |
(2,929) |
-0.1% |
|
2019 |
1,730,000 |
1,727,868 |
(2,132) |
-0.1% |
|
2020 |
2,301,000 |
2,185,069 |
(115,931) |
-5.0% |
|
2021 |
1,936,000 |
1,934,146 |
(1,854) |
-0.1% |
|
|
|
|
|
|
|
* planted acres – excludes failed acres and prevented planting. |
||||
|
Source: USDA NASS and USDA Farm Service Agency. |
||||
What might this mean? It could imply that FSA’s August 2022 long-grain planted acres of 1.786 million (shown in table below) are very close, perhaps within 2,100 acres, of this year’s harvested total. Generally, there isn’t a great deal of change from the August to the final FSA certified acres. In recent years, almost 99% of the final rice acreage is in the August reporting.
Table 5. 2022 U.S. Long-Grain Rice Acres.
Planted Acres* Reported to Farm Service Agency and NASS Harvested Acres Forecast. |
||||
|---|---|---|---|---|
unit: (1000) acres |
FSA |
NASS |
Difference |
% Difference |
August |
June 30 |
|||
|
Arkansas |
993 |
1,040 |
-47 |
-5% |
|
California |
6 |
5 |
1 |
20% |
|
Louisiana |
367 |
385 |
-18 |
-5% |
|
Mississippi |
85 |
98 |
-13 |
-13% |
|
Missouri |
148 |
180 |
-32 |
-18% |
|
Texas |
188 |
170 |
18 |
11% |
|
|
|
|
|
|
|
U.S. Total |
1,786 |
1,878 |
-92 |
-5% |
|
* Planted Acres do not include Failed Acres or Prevented Planting. Source: USDA Farm Service Agency, August 2022. |
||||
By comparison, NASS forecast long-grain harvested acres at 1.878 million in June. Using recent history as a guide, in 6 of the last 8 years NASS’ June harvested acreage forecast for long-grain has been higher than the final harvested acres. We acknowledge FSA’s numbers are preliminary, however it is interesting that long-grain acreage reported in August is 92,000 acres below NASS’ June 30 harvested acres forecast.
Exploring possibilities, assume NASS’ forecast for long-grain harvested acres is reduced by 90,000 acres. Holding the current yield forecast of 7,471 pounds constant, that could remove 6.7 million cwt. of production. With no changes to demand, ending stocks fall to 17 million cwt. The long-grain balance sheet would then look very much like it did in 2019/20, when we saw historically high prices in the first half of 2020.
The August report is the first of five (5) updates to FSA’s acreage information. This will be interesting to track as it has deep implications for 2022 production adjustments. Scheduled releases of FSA’s acreage reports are as follows:
-
Sep 12
-
Oct 12
-
Nov 9
-
Dec 9
-
Jan 2023 TBD
Data for all crops, states, and counties are reported in the following categories: planted; prevented planting; and failed. The August dataset is available at this link 2022 acreage data as of August 22, 2022.
Use the Arkansas Rice Advisor Internet App!
The Arkansas Rice Advisor site https://riceadvisor.uada.edu functions like an app on your mobile device. There you can readily access the DD50 program, rice seeding rate calculator, drill calibration, fertilizer and N rate calculators, publications, and more.
Additional Information
Arkansas Rice Updates are published periodically to provide timely information and recommendations for rice production in Arkansas. If you would like to be added to this email list, please send your request to rice@uada.edu.
This information will also be posted to the Arkansas Row Crops blog (http://www.arkansas-crops.com/) where additional information from Extension specialists can be found.
More information on rice production, including access to all publications and reports, can be found at http://www.uaex.uada.edu/rice.
Acknowledgements
We sincerely appreciate the support for this publication provided by the rice farmers of Arkansas and administered by the Arkansas Rice Research and Promotion Board.
The authors greatly appreciate the feedback and contributions of all growers, county agents, consultants, and rice industry stakeholders.
Specialist |
Area |
Phone Number |
|
|---|---|---|---|
|
Jarrod Hardke |
Rice Extension Agronomist |
501-772-1714 |
|
|
Tom Barber |
Extension Weed Scientist |
501-944-0549 |
|
|
Nick Bateman |
Extension Entomologist |
870-456-8486 |
|
|
Tommy Butts |
Extension Weed Scientist |
501-804-7314 |
|
|
Ralph Mazzanti |
Rice Verification Coordinator |
870-659-5507 |
|
|
Trent Roberts |
Extension Soil Fertility |
479-935-6546 |
|
|
Scott Stiles |
Extension Economist |
870-219-8608 |
|
|
Yeshi Wamishe |
Extension Rice Pathologist |
870-659-6864 |