Arkansas Rice Update 7-2-26
Arkansas Rice Update 2026-17
July 2, 2026
Jarrod Hardke & Scott Stiles
“I just dropped in, to see what condition my condition was in.”

Looking Good for 250
Words of advice: “Back up, Terry!”
Heading into the 4th of July weekend and the 250-year celebration, it’s hot and humid and the rice is moving fast. Many would be happy with a little rainfall assistance about now. The far northeast and southeast corners of the state have received some rains in the past week, but for most of the rest it’s getting awfully dry.
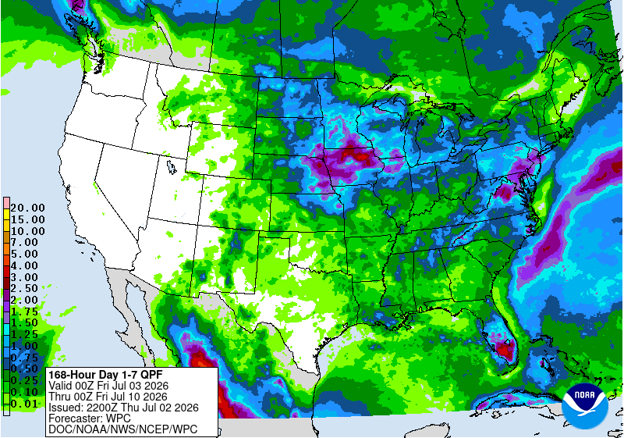
There are rain chances in the coming week – when we’re typically looking for one around the 4th. However, estimates of how much rain that might bring seem low (Fig. 1). We’re once again beginning to string together a stressful series of hot nights, but next week’s rain chances bring with them the possibility of slightly lower daytime and nighttime temperatures.
With heading getting underway, we’ll soon turn our attention to rice stink bugs (more on that next week). But for now, we’re still on the disease hunt, with most calls still about sheath blight activity and timing sprays for smut prevention.
A great breakdown of the Acreage report and stocks situation in the update below. For what it’s worth, I went into the report expecting about 800,000 total rice acres for Arkansas with 670k long-grain and 130k medium-grain. Certified acreage data will be released in early August.
In this update is info on progress, heading, disease, growth staging, markets, and the Acreage report.
Let us know if we can help.
Fig. 1. NOAA 7-day precipitation forecast.
Ricing Around
Jarrod Hardke
Heading
Increasing amounts of rice are entering heading at this point, and some of it may surprise you. Northeast Arkansas actually had some warmer temperatures earlier in the season compared to the southern part of the state that seems to have sped things up a little compared to normal.
Table 1. Percent of rice acres to reach 50% heading by week according to DD50 Rice Management Program Enrollment.
|
Date |
% of Acres at 50% Heading |
|---|---|
|
June 29 – July 5 |
1.9% |
|
July 6 – 12 |
22.0% |
|
July 13 – 19 |
40.9% |
|
July 20 – 26 |
24.2% |
|
July 27 – Aug 2 |
4.8% |
|
Aug 3 – 9 |
3.9% |
|
Aug 10 – 16 |
0.6% |
|
Aug 17 – 23 |
1.4% |
Disease
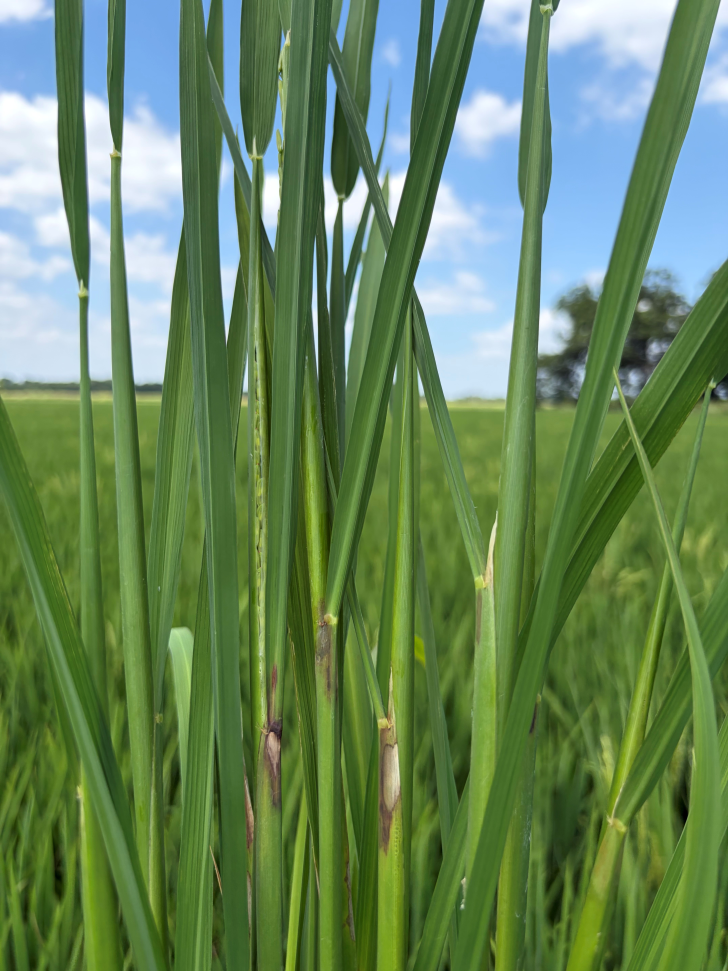
Fungicide discussions continue, but generally there has been little disease activity reported. Sheath blight is present but only on the rise in a few hotspots it seems. It looks like we may be capable of outrunning most of that problem at the moment. If we make it to 50% heading with the upper canopy leaves clean then we’ve outrun direct yield loss. The rain chances beginning Sunday into next week are a welcome sight for strained irrigation systems (if they come to pass), but it could fire up some disease activity at the same time. Scout!
Fig. 2. Sheath blight on upper rice leaves.
Growth Staging
Most cultivars take 28-40 days to progress from Beginning Internode Elongation (BIE / green ring) to reach 50% heading. For simplicity, let’s use a 36-day example (differs for all cultivars).
Generalization of Days:
Day 0 – Green Ring (BIE; R0)
Day 9 – ½” Internode Elongation (R1)
Day 18 – Early / Mid Boot (flag leaf “points”)
Day 27 – Late Boot (flag leaf collar visible, R2)
Day 36 – 50% heading (half of panicles emerging above flag leaf collar, R3)
**Generalized example – each cultivar varies with some much faster – use DD50 program for guidance.**
Panicle Length and Boot Stages:
Once we pass ½” internode elongation and you can begin to see the panicle, we’re heading toward the boot stages. While each cultivar is different in their ultimate panicle size and length, and affected by management, here are some general ideas.
Early boot – panicle is typically less than 2 inches in length; flag leaf may have begun exserting.
Mid boot – panicle is 2 to 4 inches in length; flag leaf is exserting (“point”).
Late boot – panicle is greater than 5 inches in length; flag leaf fully exserted and leaf collar visible.
Market Update
Scott Stiles
Reminder: Commodity markets will be closed Friday, July 3rd for Independence Day.
Grain markets reopen at 7 p.m. CT on Sunday, July 5, for the overnight session.
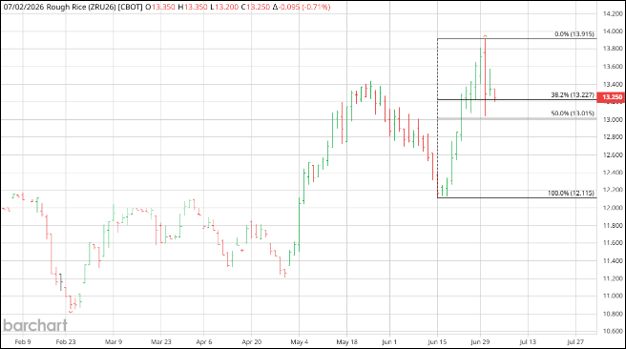
USDA’s June Acreage didn’t deliver any major surprise for the rice market. In fact, September futures made a reversal down and closed 42 cents lower in Tuesday’s session. There was no follow-through to the downside in Wednesday's trading, which ended with a 5 ½ cent gain. Pre-holiday trading Thursday morning is near $13.22 and the 38% retracement of the recent move from the June 15th low to the June 30th high at $13.91 ½. The September contract high is $13.94.
Fig. 3. CME Rough Rice September 2026, Daily Chart.
June Acreage:
As expected, U.S. rice acres are seen falling to historically low levels this year. At 2.017 million, total acreage is the lowest since 1972. Continued weakness in rice prices and a sharp increase in fuel and fertilizer this spring led to reductions in rice acres in all states. Arkansas acres are the lowest since 1977. Mississippi acreage is the lowest since 1961 and Texas’ acreage is the lowest since records began in 1929.
Table 2. U.S. Total Rice Acres.
|
Unit: thousand acres |
June 2026 |
Chg from March |
March 2026 |
2025 |
2024 |
2023 |
2022 |
2021 |
5-Yr Avg. 21-25 |
|
Arkansas |
851 |
-150 |
1,001 |
1,284 |
1,448 |
1,436 |
1,104 |
1,211 |
1,297 |
|
California |
455 |
-53 |
508 |
524 |
476 |
516 |
254 |
407 |
435 |
|
Louisiana |
400 |
-30 |
430 |
482 |
473 |
468 |
422 |
420 |
453 |
|
Mississippi |
45 |
-35 |
80 |
164 |
155 |
121 |
87 |
104 |
126 |
|
Missouri |
153 |
-22 |
175 |
213 |
219 |
205 |
157 |
199 |
199 |
|
Texas |
113 |
-12 |
125 |
145 |
148 |
149 |
195 |
190 |
165 |
|
U.S. |
2,017 |
-302 |
2,319 |
2,812 |
2,919 |
2,895 |
2,219 |
2,531 |
2,675 |
Source: USDA NASS.
The larger, and most important focus of the Acreage report was USDA lowering U.S. long-grain acreage to 1.395 million, down 253,000 acres from their March estimate of 1.648 million. The table below provides details of the USDA’s state-level planted acreage estimates. The largest reduction in acres from USDA’s previous estimate was a 170,000-acre cut in Arkansas. At 730,000, that is Arkansas’ lowest long-grain acreage since 1977. U.S. long-grain acreage is the lowest since 1974 at 1.395 million.
Table 3. U.S. Long-Grain Rice Acres.
|
Unit: thousand acres |
June 2026 |
Chg from March |
March 2026 |
2025 |
2024 |
2023 |
2022 |
2021 |
5-Yr Avg. 21-25 |
|
Arkansas |
730 |
-170 |
900 |
1,180 |
1,330 |
1,220 |
1,000 |
1,095 |
1,165 |
|
California |
10 |
2 |
8 |
9 |
8 |
11 |
7 |
7 |
8 |
|
Louisiana |
350 |
-20 |
370 |
420 |
425 |
390 |
370 |
380 |
397 |
|
Mississippi |
45 |
-35 |
80 |
160 |
153 |
121 |
87 |
103 |
125 |
|
Missouri |
150 |
-20 |
170 |
209 |
214 |
197 |
152 |
195 |
193 |
|
Texas |
110 |
-10 |
120 |
140 |
145 |
125 |
190 |
188 |
158 |
|
U.S. |
1,395 |
-253 |
1,648 |
2,118 |
2,275 |
2,064 |
1,806 |
1,968 |
2,046 |
Source: USDA NASS.
The complete June Acreage report can be found here: Acreage.
USDA will incorporate the June Acreage into the July 10th WASDE. A major downward revision in U.S. long-grain production is expected in next week’s report. In the June WASDE, USDA estimated 2026/27 long-grain production at 122.5 million cwt. This estimate was derived from the March intended acres of 1.648 million and an approximate yield of 7,543 pounds. Using the same yield and harvested acreage of 1.375 million lowers production to 103.7 million cwt. – down almost 18.8 million cwt. from USDA’s June estimate. This would be the smallest U.S. long-grain production since 1993.
Table 4. U.S. Long-Grain Rice Supply and Demand, 2026/27.
|
USDA |
UA |
|
|
unit: million cwt. |
2026/27 |
2026/27 |
|
June |
July est. |
|
|
Beginning Stocks |
40.6 |
40.6 |
|
Production |
122.5 |
103.7 |
|
Imports |
39.0 |
39.0 |
|
Total Supply |
202.1 |
183.3 |
|
Domestic Use |
123.0 |
|
|
Exports |
50.0 |
|
|
Total Use |
173.0 |
|
|
Carry-Over |
29.1 |
|
|
stocks-use % |
16.8% |
|
Source: USDA World Agricultural Supply and Demand Estimates.
The dirty work begins. How will USDA navigate a sharp reduction in crop size in the July WASDE? It is difficult to predict all the possible changes that could be made to the 26/27 long-grain balance sheet. With U.S. rice prices on the rise, will imports be increased? On lower acres, will the U.S. average yield be increased? There’s still room for 25/26 exports to be lowered again. That could boost new crop beginning stocks. That’s just the supply-side of the equation.
On lower production we generally see USDA reduce its export estimates. Until this year, we’ve never seen domestic use equal 100% of production. Historically, it’s about 75 to 80% on average. Put simply, a deep cut in production and a corresponding cut in ending stocks is not as straight forward as it might seem. There will be offsetting adjustments to demand and some possible tweaks to beginning stocks and imports as well. We’ll have all the details next week.
The next USDA WASDE report will be released on July 10th at 11:00 a.m. CT. The report can be found here: WASDE Report.
Happy Independence Day! Take time to enjoy this great country’s 250th anniversary.
DD50 Rice Management Program is Live
The DD50 Rice Management Program is live and ready for fields to be enrolled for the 2026 season. All log-in and producer information has been retained from the 2025 season, so if you used the program last year you can log in just as you did last year. Log in and enroll fields here: https://dd50.uada.edu.
Use the Arkansas Rice Advisor Internet App!
The Arkansas Rice Advisor site https://riceadvisor.uada.edu functions like an app on your mobile device. There you can readily access the DD50 program, rice seeding rate calculator, drill calibration, fertilizer and N rate calculators, publications, and more.
Additional Information
Arkansas Rice Updates are published periodically to provide timely information and recommendations for rice production in Arkansas. If you would like to be added to this email list, please send your request to rice@uada.edu.
This information will also be posted to the Arkansas Row Crops blog (http://www.arkansas-crops.com/) where additional information from Extension specialists can be found.
More information on rice production, including access to all publications and reports, can be found at http://www.uaex.uada.edu/rice.
Acknowledgements
We sincerely appreciate the support for this publication provided by the rice farmers of Arkansas and administered by the Arkansas Rice Research and Promotion Board.
The authors greatly appreciate the feedback and contributions of all growers, county agents, consultants, and rice industry stakeholders.
Specialist |
Area |
Phone Number |
|
|---|---|---|---|
|
Jarrod Hardke |
Rice Extension Agronomist |
501-772-1714 |
|
|
Tom Barber |
Extension Weed Scientist |
501-944-0549 |
|
|
Nick Bateman |
Extension Entomologist |
870-456-8486 |
|
|
Ralph Mazzanti |
Rice Verification Coordinator |
870-659-5507 |
|
|
Trent Roberts |
Extension Soil Fertility |
479-935-6546 |
|
|
Bob Scott |
Extension Weed Scientist |
501-837-0273 |
|
|
Scott Stiles |
Extension Ag Economics |
501-258-8455 |