Arkansas Rice Update 4-28-23
Arkansas Rice Update 2023-06
April 28, 2023
Jarrod Hardke and Tommy Butts
“You don’t tug on Superman’s cape, you don’t spit into the wind.”

Opinions Vary
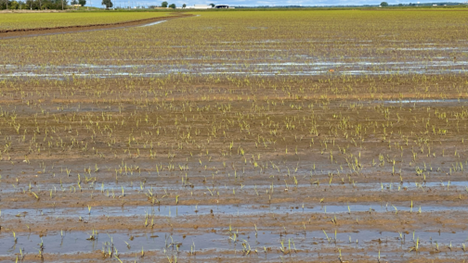
With a lot of rice planted, an increasing amount is emerged. And what a time to be an emerged rice plant. The cool, wet weather has rice looking a little mangy, or you might say raggedy. It’s nothing a little sunshine and warmer temperatures won’t cure, and quickly. As we turn the corner into next week it looks like that’s exactly what we have in store and the crop should start to truly move along.
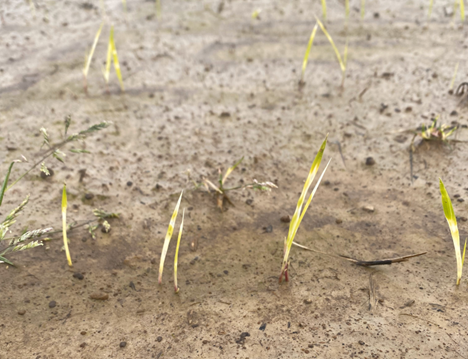
Command whitening is going to look worse right now (more on that later in update), a general pale yellow non-descript deficiency look is likely, and then the cool nights have added some white striping to leaves (which makes it look like severe Command injury when it’s not). No fertilizer shot is going to generate a response. Neither is a jug of wombat elixir applied at just the right phase of the moon. Time + temperature + sun = healthy rice. Save your money.
While the rice will grow right on out, seedling disease could still be a concern and may become noticeable once most healthy rice starts to grow off normally. Rice that has been emerged for a little while is no longer really protected by fungicide seed treatments – it needs to be able to outgrow potential disease infection. Under cool, wet, cloudy weather that makes things tough. We haven’t seen a bad bout with seedling disease in a while, so let’s hope this cool spell was short enough that these comments are much ado about nothing. But for the record, no foliar fungicide app is going to shut down seedling disease, so don’t attempt that route.
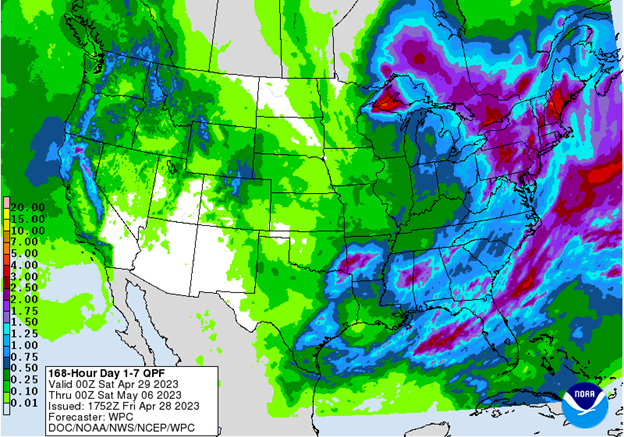
Rainfall amounts received this week varied, with some receiving far more than they bargained for but some others wishing for a little rain. In fact, some are getting very dry while others have fields submerged due to excess rain right now. Every spot in the state is its own island at this point.
Counties in the northeast have 80-90% of their rice planted. Meanwhile, counties in central and southeast aren’t as far along with 50-70% of their rice planted. That gap tells where the rains have and have not been most frequent. Potential rainfall to come tonight and the end of next week may continue to slow progress in the areas already further behind.
Let us know if we can help.
Fig. 1. NOAA 7-day precipitation forecast.
I still feel that both my estimates and the report are lagging behind actual progress seen in the field. Saying maybe 60% planted or more last week was probably on the low end of reality, and we most likely belong at around 75% - and it’s uncertain at this time how much higher it should be this week because dry versus wet areas were variable.
Table 1. U.S. Rice Planting Progress as of April 23, 2023 (USDA-NASS).
State |
Week EndingApril 23, 2022 |
Week EndingApril 16, 2023 |
Week EndingApril 23, 2023 |
2018-2022Average |
|---|---|---|---|---|
|
Arkansas |
13 |
33 |
51 |
32 |
|
California |
-- |
-- |
-- |
3 |
|
Louisiana |
79 |
83 |
86 |
82 |
|
Mississippi |
23 |
25 |
39 |
29 |
|
Missouri |
1 |
30 |
63 |
24 |
|
Texas |
76 |
55 |
74 |
78 |
|
|
|
|
|
|
|
U.S. |
25 |
38 |
51 |
37 |
Fig. 2. 2012-2023 Arkansas rice planting progress by week (USDA-NASS).
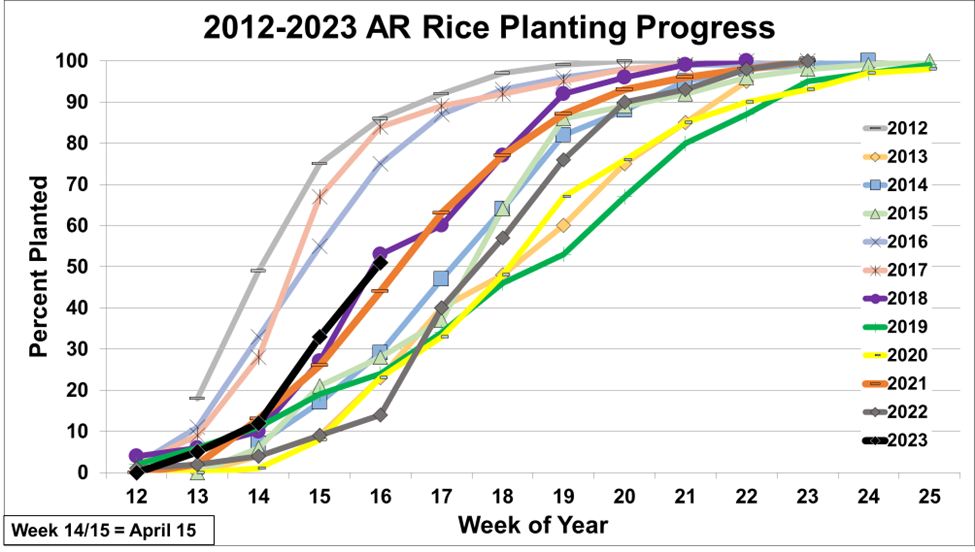
Fig. 3. Seedling rice with a pale color due to low temperatures and wet conditions.
Herbicide Activity in our Current Weather Patterns
Tommy Butts
We always like to say a little bleaching on our rice is a good thing; it means it’s working, and we picked the best rate possible. Unfortunately, from the calls we’re receiving over the past week, it seems this has come back to bite us this year. The cool, wet weather we’ve been slammed with for an extended period of time here (and looks like it will continue on through next week) has enhanced the activity of our Command and we’re not collecting many heat units for our rice, so growth is slow. This forces the rice to have to metabolize more of the herbicide than it normally does with typical growth rates.
So, the main question is, how bad is this for our rice? And the answer is, it depends. Sorry it’s a cop out answer, but it’s the reality! There are many factors that go into this type of crop injury including the exact soil texture, soil pH, how long ago the herbicide was applied and rice was planted, and what the exact rate applied was. We have seen in the past where due to this extended type of weather pattern, we can kill some rice with Command. However, on the whole, this is more the exception than the rule. Most often than not, as long as we still have a little green to the rice, and we get out of this cool weather pattern somewhat soon, the rice will turn around for us; it’s resilient!
So, what can we do? We really just need to ride out the storm. There’s nothing we can add to the system to help get the rice to grow out of it; it really just needs some heat and sun. The one thing we can do is try to eliminate any other stress occurring on the rice. This means maybe avoiding that overlapping application of Command or Facet right now. Also avoiding some postemergence herbicides like Sharpen, Stam, Ricestar, Clincher, or Provisia/Highcard (Provisia/MaxAce rice) would be a good idea until we can get back into better weather conditions. One silver lining, since our rice isn’t growing great due to the cool weather, neither are our most problematic weeds such as barnyardgrass, annual flatsedges, or weedy rice. This means we have a little extra time before needing that next herbicide application. If you absolutely want to get an application out right now, Prowl and Bolero or Newpath/Preface (Clearfield/FullPage rice) are probably the safest options at the moment.
Overall, let’s keep our fingers crossed for a little warmer weather and a stretch of sun, and we’ll be hitting flood before we know it. As always, don’t hesitate to get ahold of us with any questions, and good luck out there!
Fig. 4. Whitening from Command and white banding from cold temperatures on seedling rice.
Weather You Like It or Not
Jarrod Hardke
There’s no question we’ve had plenty of rain to start this year. Just how much? 2023 now ranks as the second wettest year thru the end of April on record – just 0.36 inches behind 1882’s total. With more rain possible tonight, there’s still a chance this year takes over the top spot.
With this much rainfall, and given the drought last summer, there is definitely conversation around a “return to the mean” for the rest of the year. When you look at Table 2 below – the years are listed in order of their rank for total rainfall through April 30. The far right column shows how they ended up ranked for their annual total. The good news is that the majority of the years on this list ended up with high overall totals for the year, suggesting that a severe lack of rainfall through the summer isn’t necessarily a likely occurrence.
Certainly, we can’t predict the future weather to that degree, but it’s easy to see that reasonable amounts of rainfall fell in May-August each of these years. But of course, there can be a difference between the rainfall received in Little Rock and the rainfall experienced across the eastern Arkansas delta.
On that note, Table 3 is included to show some recent differences between precipitation accumulation in Little Rock and Newport. Many times, you can see rain stop as it gets to the delta or start when it gets there, so there are always different stories to tell. Note that from 2000 to now, only 2019 has more rain to this point in the year than 2023. It’s all about how and when the rain falls, because we had only 25% of our rice planted at this point in 2019.
Table 2. Monthly Rainfall Accumulation Sorted by Wettest Years Through April 30, 1895-2023, (Little Rock, AR).
Year |
Jan |
Feb |
Mar |
Apr |
May |
Jun |
Jul |
Aug |
Sep |
Oct |
Nov |
Dec |
TOT |
Annual Total Rank |
|---|---|---|---|---|---|---|---|---|---|---|---|---|---|---|
|
1882 |
8.17 |
12.74 |
6.25 |
5.59 |
15.91 |
1.96 |
5.17 |
3.17 |
3.03 |
6.05 |
6.17 |
1.33 |
75.54 |
2 |
|
2023 |
8.07 |
7.62 |
8.44 |
8.26 |
-- |
-- |
-- |
-- |
-- |
-- |
-- |
-- |
32.39 |
-- |
|
1913 |
11.29 |
3.78 |
4.47 |
11.46 |
2.34 |
2.05 |
3.74 |
2.4 |
9.25 |
4.78 |
3.05 |
2.96 |
61.57 |
17 |
|
1973 |
5.64 |
2.95 |
7.89 |
14.2 |
3.96 |
2.66 |
6.59 |
1.26 |
9.09 |
5.93 |
9.03 |
5.19 |
74.39 |
3 |
|
1990 |
6.5 |
4.82 |
10.4 |
7.73 |
7.71 |
0.8 |
4.63 |
1.57 |
4.08 |
8.75 |
3.29 |
6.87 |
67.15 |
7 |
|
1950 |
12.53 |
9.27 |
4.9 |
2.75 |
8.37 |
2.07 |
1.87 |
7.59 |
6.77 |
1.29 |
3.9 |
1.55 |
62.86 |
14 |
|
1927 |
4.5 |
3.03 |
6.89 |
14.81 |
6.82 |
5.71 |
1.09 |
8.81 |
1.37 |
1.37 |
8.18 |
3.82 |
66.4 |
8 |
|
1890 |
8.48 |
6.48 |
5.79 |
7.77 |
6.16 |
8.28 |
1.83 |
2.59 |
5.55 |
2.75 |
5.21 |
2.83 |
63.72 |
12 |
|
1884 |
3.45 |
9.79 |
4.67 |
10.24 |
7.33 |
2.18 |
4.23 |
3.26 |
5 |
1.3 |
2.83 |
16.92 |
71.2 |
5 |
|
1957 |
5.95 |
5.32 |
5.12 |
11.34 |
11.58 |
3.39 |
2.8 |
4.31 |
1.96 |
5.42 |
9.54 |
3.88 |
70.61 |
6 |
|
1939 |
7.86 |
8.59 |
2.47 |
7.97 |
6.95 |
3.14 |
2.11 |
2.92 |
2.36 |
0.66 |
3.93 |
1.41 |
50.37 |
51 |
|
1897 |
8.51 |
1.76 |
10.43 |
5.88 |
1.15 |
3.06 |
1.03 |
4.14 |
0.33 |
1.95 |
2.97 |
5.57 |
46.78 |
78 |
|
1923 |
7.42 |
6.42 |
5 |
7.69 |
10.5 |
1.8 |
7.86 |
2.55 |
3.93 |
1 |
2.59 |
4.7 |
61.46 |
18 |
|
1953 |
6.11 |
3.29 |
9.49 |
7.28 |
6.19 |
0.12 |
1.19 |
2.67 |
1.14 |
1.02 |
1.72 |
2.95 |
43.17 |
103 |
|
1912 |
3.54 |
2.74 |
9.05 |
10.76 |
1.81 |
3.84 |
1.93 |
4.98 |
2.59 |
3.87 |
0.63 |
2.22 |
47.96 |
68 |
|
2018 |
2.22 |
14.04 |
3.85 |
5.97 |
2.46 |
2.86 |
3.29 |
6.59 |
7.02 |
8.21 |
4.58 |
10.32 |
71.41 |
4 |
Table 3. Comparison of annual precipitation in Little Rock versus Newport, 2000-2022.
Year |
Little Rock |
Newport |
Difference |
|---|---|---|---|
|
2000 |
41.79 |
40.15 |
-1.64 |
|
2001 |
47.58 |
54.49 |
6.91 |
|
2002 |
46.59 |
56.5 |
9.91 |
|
2003 |
39.48 |
53.54 |
14.06 |
|
2004 |
56.05 |
53.06 |
-2.99 |
|
2005 |
34.55 |
31.58 |
-2.97 |
|
2006 |
48.75 |
45.56 |
-3.19 |
|
2007 |
44.43 |
47.95 |
3.52 |
|
2008 |
58.16 |
50.45 |
-7.71 |
|
2009 |
81.79 |
84.15 |
2.36 |
|
2010 |
36.51 |
37.81 |
1.3 |
|
2011 |
60.23 |
60.58 |
0.35 |
|
2012 |
42.26 |
40.14 |
-2.12 |
|
2013 |
52.78 |
55.81 |
3.03 |
|
2014 |
48.13 |
44.83 |
-3.3 |
|
2015 |
61.23 |
47.66 |
13.43 |
|
2016 |
56.12 |
44.25 |
-11.87 |
|
2017 |
47.26 |
45.02 |
-2.24 |
|
2018 |
71.41 |
60.42 |
-10.99 |
|
2019 |
60.46 |
69.71 |
9.25 |
|
2020 |
60.04 |
62.32 |
2.28 |
|
2021 |
43.71 |
50.69 |
6.98 |
|
2022 |
48.28 |
49.68 |
1.4 |
|
2023* |
32.39* |
27.28* |
-5.11* |
*Thru April 27.
DD50 Rice Management Program is Live
The DD50 Rice Management Program is live and ready for fields to be enrolled for the 2023 season. All log-in and producer information has been retained from the 2022 season, so if you used the program last year you can log in just as you did last year. Log in and enroll fields here: https://dd50.uada.edu.
Use the Arkansas Rice Advisor Internet App!
The Arkansas Rice Advisor site https://riceadvisor.uada.edu functions like an app on your mobile device. There you can readily access the DD50 program, rice seeding rate calculator, drill calibration, fertilizer and N rate calculators, publications, and more.
Additional Information
Arkansas Rice Updates are published periodically to provide timely information and recommendations for rice production in Arkansas. If you would like to be added to this email list, please send your request to rice@uada.edu.
This information will also be posted to the Arkansas Row Crops blog (http://www.arkansas-crops.com/) where additional information from Extension specialists can be found.
More information on rice production, including access to all publications and reports, can be found at http://www.uaex.uada.edu/rice.
Acknowledgements
We sincerely appreciate the support for this publication provided by the rice farmers of Arkansas and administered by the Arkansas Rice Research and Promotion Board.
The authors greatly appreciate the feedback and contributions of all growers, county agents, consultants, and rice industry stakeholders.
Specialist |
Area |
Phone Number |
|
|---|---|---|---|
|
Jarrod Hardke |
Rice Extension Agronomist |
501-772-1714 |
|
|
Tom Barber |
Extension Weed Scientist |
501-944-0549 |
|
|
Nick Bateman |
Extension Entomologist |
870-456-8486 |
|
|
Tommy Butts |
Extension Weed Scientist |
501-804-7314 |
|
|
Ralph Mazzanti |
Rice Verification Coordinator |
870-659-5507 |
|
|
Camila Nicolli |
Extension Rice Pathologist |
870-830-2232 |
|
|
Trent Roberts |
Extension Soil Fertility |
479-935-6546 |