Arkansas Rice Update 4-10-26
Arkansas Rice Update 2026-05
April 10, 2026
Jarrod Hardke, Scott Stiles, & Bob Scott
“Dust on my boots, dust on my truck…”

Devil is in the Dust
Rice planting progress is starting to happen fast. While it was clear a jump in progress happened last week I was anticipating 15% planting while instead it came in at 25% on Monday (Fig. 1). This week has seen tremendous planting effort, to the point I struggle at a guess. But it does look like it will rival record pace years of 2016 and 2017 as a result of extremely dry conditions and major reductions in acres.
At the moment, the dry conditions are the primary problem calls. A welcome rain was received by many last weekend to improve immediate conditions for planting, but it wasn’t enough to provide lasting impact. The dreaded word ‘flush’ continues to be thrown about with much frustration. Rice planted shallow for typical late March, early April conditions is having a rough go of it. Continued issues with various stages of rice development – some emerging, some just germinating, some seed still sitting in the dry. Residual herbicides are a topic covered further below.
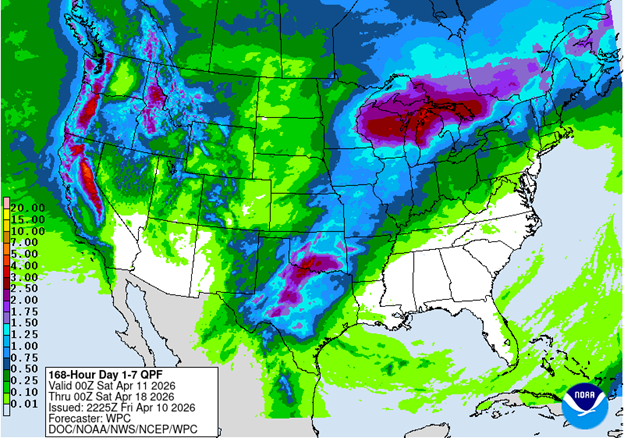
Hope for some rainfall relief over the coming week doesn’t look good (Fig. 2). A little shift to the east in the pattern could turn things around fast in the immediate, but there are still greater concerns about the season with how far behind we are on total rainfall and the lack of subsoil moisture.
Reservoir / surface water levels are a very real concern for continued planting of rice acres in areas where folks depend on it. Without sufficient rainfall to generate runoff to fill these water sources, it’s proving difficult for people to plant the acres they had been planning on at this point.
In this update is info on DD50 rice management program, historical rainfall, quinclorac formulations, weed control and residuals, rice markets and PLC updates.
Let us know if we can help.
Fig. 1. Arkansas rice weekly planting progress, 2013-2026.
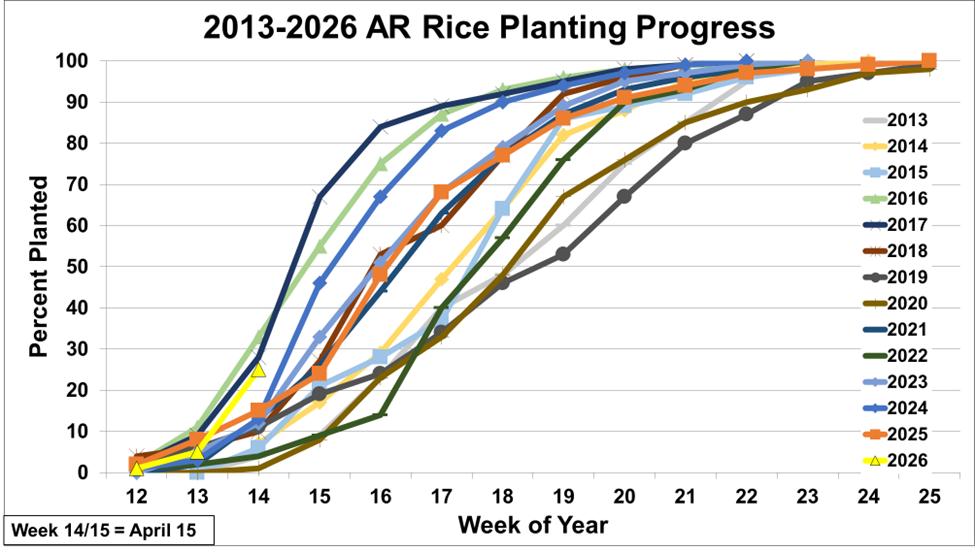
Fig. 2. NOAA 7-day precipitation forecast.
DD50 Rice Management Program is Live
The DD50 Rice Management Program is live and ready for fields to be enrolled for the 2026 season. All log-in and producer information has been retained from the 2025 season, so if you used the program last year you can log in just as you did last year. Log in and enroll fields here: https://dd50.uada.edu.
Rain or Lack Thereof
Jarrod Hardke
It’s not our imagination; it really is drier than we can remember seeing. 2026 marks the 10th lowest rainfall accumulation Jan-Mar of any year on record (Little Rock) (Table 1). It also marks the 4th lowest Nov-Mar period on record (Table 2). Using a single location of data doesn’t do the delta situation full justice – there’s been even less rainfall in parts of eastern Arkansas, but this is the most complete dataset available.
Table 1. Lowest January 1 to March 31 total rainfall accumulation for Little Rock, AR, 1876 to present (and subsequent April-May rainfall).
|
Year |
Jan-Mar Total |
April |
May |
|---|---|---|---|
|
1947 |
4.18 |
6.10 |
6.87 |
|
1936 |
4.58 |
3.10 |
1.24 |
|
1928 |
5.45 |
7.01 |
3.86 |
|
1925 |
5.81 |
1.08 |
1.42 |
|
1940 |
5.92 |
5.58 |
3.28 |
|
1941 |
6.38 |
4.97 |
4.10 |
|
1972 |
6.58 |
1.81 |
2.07 |
|
1911 |
7.34 |
10.72 |
0.82 |
|
1963 |
7.38 |
3.29 |
1.29 |
|
2026 |
7.44 |
-- |
-- |
|
1971 |
7.52 |
1.70 |
537 |
|
1967 |
7.55 |
7.58 |
8.69 |
|
1986 |
7.63 |
7.33 |
4.07 |
|
1924 |
7.9 |
5.43 |
2.44 |
|
1983 |
7.93 |
6.72 |
7.58 |
Source: Southern Regional Climate Center
Table 2. Lowest November thru March total rainfall accumulation for Little Rock, AR, 1876 to present.
|
Fall Year (Nov-Dec) |
Spring Year (Jan-Mar) |
Total (Nov-Mar) |
|---|---|---|
|
1935 |
1936 |
8.85 |
|
1924 |
1925 |
10.23 |
|
1962 |
1963 |
10.72 |
|
2025 |
2026 |
11.09 |
|
1939 |
1940 |
11.26 |
|
1917 |
1918 |
11.29 |
|
1965 |
1966 |
12.37 |
|
1910 |
1911 |
12.83 |
|
1970 |
1971 |
13.46 |
|
1995 |
1996 |
13.47 |
|
2005 |
2006 |
13.82 |
Source: Southern Regional Climate Center
Quinclorac Products and Rates
Jarrod Hardke
Each year there is some confusion over quinclorac products and rates. The most common products of Facet, Zurax, Quinstar, and Prize have different rates. The rate range for Facet L or Zurax L is 22-43 oz/acre while the rate range for Quinstar and Prize is 8-16 oz/acre. Use of rates outside these ranges is off-label and can result in excessive crop injury. Use caution when applying these products to ensure the appropriate rate.
Table 3. Common quinclorac herbicide products and rate ranges.
|
Facet L (1.5 lb/gal) Zurax (1.5 lb/gal) |
Quinstar 4L (3.8 lb/gal) |
Prize (4.0 lb/gal) |
|||
|---|---|---|---|---|---|
|
Rate (oz) |
Active (lb) |
Rate (oz) |
Active (lb) |
Rate (oz) |
Active (lb) |
|
n/a |
n/a |
8 |
0.238 |
8 |
0.250 |
|
n/a |
n/a |
9 |
0.267 |
9 |
0.281 |
|
n/a |
n/a |
10 |
0.297 |
10 |
0.313 |
|
n/a |
n/a |
11 |
0.327 |
11 |
0.344 |
|
n/a |
n/a |
12 |
0.356 |
12 |
0.375 |
|
n/a |
n/a |
16 |
0.475 |
16 |
0.500 |
|
22 |
0.258 |
n/a |
n/a |
n/a |
n/a |
|
24 |
0.281 |
n/a |
n/a |
n/a |
n/a |
|
26 |
0.305 |
n/a |
n/a |
n/a |
n/a |
|
28 |
0.328 |
n/a |
n/a |
n/a |
n/a |
|
32 |
0.375 |
n/a |
n/a |
n/a |
n/a |
|
43 |
0.504 |
n/a |
n/a |
n/a |
n/a |
* Read and follow label directions.
Bobbing and Weeding
Jarrod Hardke & Bob Scott
- Residual herbicides under dry conditions
- Expect most residuals to be gone after 7 days without activation.
- There can still be some activity, but any expectation of real weed control just isn’t there.
- One wrinkle may be with Command. It seems like it will sit there longer and retain a little more activity, but we might at times be mistaking some later whitening on the rice to indicate there’s enough for some weed control when that really wasn’t the case.
- Consider taking additional residual herbicides out of the mix if you have low confidence in 7-day rainfall. Save that money for later. Still consider having the Command in with the burndown (glyphosate) because it’s some cheaper insurance should you luck into catching a rain. Yes, it was just said to consider taking residuals out, but missing a rain on $7-10 worth of Command is worth the risk/reward on controlling grass if a rain does happen.
- Burndown applications – reminder that when mixing glyphosate and Command to keep the rate of glyphosate up to avoid reduced control from antagonism, but this is a good tank mix. Some may be confusing past issues where Gramoxone was in that mix at times causing major issues. We don’t know where and when Gramoxone + Command will misbehave in the tank, and we’ve tried to replicate it and can’t. We just know it happens at random so best to avoid.
Market Update
Scott Stiles
Reminder: April 17, 2026 is the deadline to apply for Farmer Bridge Assistance (FBA).
As of April 7th, USDA had disbursed $313.8 million in FBA payments to Arkansas producers. Rice accounted for $153 million (49%) of the total payments since enrollment opened February 23rd. More information on the Farmer Bridge Assistance Program can be found at this link: Farmer Bridge Assistance (FBA) Program.
USDA April WASDE:
The April WASDE is generally a “low-key” report, and it was for the major grains and cotton. However, USDA made some significant demand adjustments to the 2025/26 long-grain balance sheet. Domestic & Residual use was lowered by 2.0 million cwt to 137.0 million. Based on the March 1 Rice Stocks report, implied December to February usage was less than previously estimated. Exports were reduced by 3.0 million cwt to 51.0 million on continued slow sales and shipments to Mexico and other Central and South American markets. Ending stocks increased by 5.0 million cwt to 41.6 million, the highest since 1985/86. The 2025/26 season-average farm price (SAFP) for long-grain was lowered by $0.10 per cwt to $10.40 ($4.68/bu.), while the southern medium-grain SAFP was raised $0.50 per cwt to $14.70.
Table 4. U.S. Long-Grain Supply and Demand
|
2025/26 |
monthly change |
|||
|---|---|---|---|---|
|
unit: million cwt. |
2024/25 |
March |
April |
|
|
Beginning Stocks |
19.3 |
37.30 |
37.30 |
0.0 |
|
Production |
172 |
153.3 |
153.3 |
0.0 |
|
Imports |
42.7 |
39.0 |
39.0 |
0.0 |
|
Total Supply |
234 |
229.6 |
229.6 |
0.0 |
|
Domestic Use |
135.8 |
139 |
137 |
(2.0) |
|
Exports |
60.8 |
54 |
51 |
(3.0) |
|
Total Use |
196.6 |
193.0 |
188.0 |
(5.0) |
|
Carry-Over |
37.3 |
36.6 |
41.6 |
5.0 |
|
stocks-use % |
19.0% |
19.0% |
22.1% |
|
|
Avg. Producer Price ($/cwt.) |
$ 14.00 |
$ 10.50 |
$ 10.40 |
$ (0.10) |
|
Avg. Producer Price ($/bu.) |
$ 6.30 |
$ 4.73 |
$ 4.68 |
$ (0.04) |
|
PLC Reference Price ($/bu.) |
$ 6.30 |
$ 7.61 |
$ 7.61 |
$ - |
|
Proj. PLC Payment Rate ($/bu.) |
$ - |
$ 2.89 |
$ 2.93 |
$ 0.04 |
Source: USDA, World Agricultural Supply and Demand Estimates (WASDE), April 2026.
April makes the 5th consecutive month USDA has lowered its 2025/26 long-grain export forecast. At 51 million cwt., USDA’s export outlook has fallen considerably from the initial forecast of 68 million released last May. Without improved sales in the final 1/3 of the marketing year, further reductions in exports may be warranted. USDA’s April forecast of 51 million cwt. would be a 16% decline from the 2024/25 exports of 60.8 million. Weekly Export Sales data through April 2nd indicate long-grain sales are running about 26% below last year.
With no supply side offsets to the sizeable reduction in demand this month, the historically large ending stocks continue to limit the upside in old crop prices. USDA lowered its 2025 crop price outlook this month by 4 cents to $4.68 per bushel. This increases the 2025 PLC projected payment rate to $2.93 per bushel.
Table 5. 2025 PLC Payment Example, Long-Grain Rice
|
A. |
PLC Payment Yield (state average, bu./ac.) |
139.2 bu. |
|
B. |
Effective Reference Price ($/bu.) |
$7.61 |
|
C. |
MYA Price (April USDA projection, $/bu.) |
$4.68 |
|
D. |
PLC Payment Rate (B - C) |
$2.93 |
|
|
PLC Payment per Base Acre (A * D * 85% - 5.7%) |
$326.92 |
PLC payments are made on 85% of base acres. The payment formula is PLC yield * Payment Rate * 85%. We are also assuming in the example, budget sequestration will be deducted from 2025 Agriculture Risk Coverage (ARC) and Price Loss Coverage (PLC) farm program payments. Estimates for 2025 and 2026 ARC/PLC payments typically factor in an expected 5.7% sequestration rate. After all reductions, including sequestration, individual payments are subject to a limit of $155,000 per person for the 2025 crop year.
Planting Progress:
NASS reported Monday that 30% of the 2026 US rice crop has been planted. All states except Texas are running ahead of last year and the 5-year average.
Table 6. Rice, Percent Planted, Week Ending April 5, 2026.
|
State (% planted) |
April 5, 2026 |
Last Week |
Last Year |
5-year avg. |
|---|---|---|---|---|
|
Arkansas |
25 |
5 |
14 |
8 |
|
Louisiana |
75 |
66 |
67 |
63 |
|
Mississippi |
28 |
8 |
14 |
7 |
|
Missouri |
9 |
1 |
2 |
3 |
|
Texas |
50 |
31 |
58 |
50 |
|
U.S. |
30 |
|
23 |
18 |
|
Source: USDA NASS, Crop Progress, April 5, 2026. |
||||
Use the Arkansas Rice Advisor Internet App!
The Arkansas Rice Advisor site https://riceadvisor.uada.edu functions like an app on your mobile device. There you can readily access the DD50 program, rice seeding rate calculator, drill calibration, fertilizer and N rate calculators, publications, and more.
Additional Information
Arkansas Rice Updates are published periodically to provide timely information and recommendations for rice production in Arkansas. If you would like to be added to this email list, please send your request to rice@uada.edu.
This information will also be posted to the Arkansas Row Crops blog (http://www.arkansas-crops.com/) where additional information from Extension specialists can be found.
More information on rice production, including access to all publications and reports, can be found at http://www.uaex.uada.edu/rice.
Acknowledgements
We sincerely appreciate the support for this publication provided by the rice farmers of Arkansas and administered by the Arkansas Rice Research and Promotion Board.
The authors greatly appreciate the feedback and contributions of all growers, county agents, consultants, and rice industry stakeholders.
Specialist |
Area |
Phone Number |
|
|---|---|---|---|
|
Jarrod Hardke |
Rice Extension Agronomist |
501-772-1714 |
|
|
Tom Barber |
Extension Weed Scientist |
501-944-0549 |
|
|
Nick Bateman |
Extension Entomologist |
870-456-8486 |
|
|
Ralph Mazzanti |
Rice Verification Coordinator |
870-659-5507 |
|
|
Trent Roberts |
Extension Soil Fertility |
479-935-6546 |
|
|
Bob Scott |
Extension Weed Scientist |
501-837-0273 |
|
|
Scott Stiles |
Extension Ag Economics |
501-258-8455 |