Arkansas Rice Update 12-12-25
Arkansas Rice Update 2025-27
December 12, 2025
Jarrod Hardke, Scott Stiles, & Trent Roberts
“We gotta get out of this place, if it’s the last thing we ever do.”

No Good News
If I had a nickel for every time I have been asked this fall if I had any good news, I would have a lot of nickels. And no, I don’t have any good news. If you go down the rabbit hole, you’ll eventually find the rabbit. His name is Jeff. He doesn’t know what’s going on either.
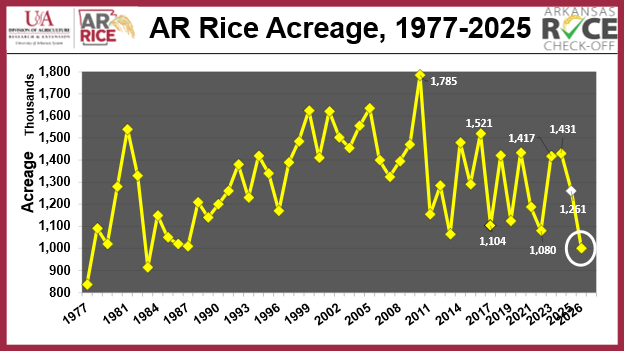
What does appear to be happening is a historical reduction in Arkansas rice acres. At the moment, I am circling 1 million for the total rice acres in Arkansas for 2026. The story will be what kind of planting weather we have – if it’s not great, we don’t make it to 1 million – if it’s great, we likely creep over.
Fig. 1 shows the 1977 to 2025 harvested rice acreage for Arkansas. 1983 was the last time the state failed to plant 1 million acres of rice. The 2013 and 2022 seasons were the most recent that we even fell below 1.1 million acres. But 2026 will be unprecedented – the combination of high input costs and low rice price. Soybean and corn are looking more favorable.
The reality is that given the current supply situation, this correction is needed. We can only hope that the situation has improved by this time next year, because if this happens for another year it could have long-lasting consequences and repercussions for the Arkansas rice industry.
Read on below for more information on the winter production meeting schedule, net return evaluation from 2023-2025 ARPT, dry soil condition impact on soil tests, and a rice market update including info on the FBA.
Let us know if we can help.
Fig. 1. Arkansas rice acreage, 1977-2025 (+2026 forecast).
2026 Winter Meeting Schedule
https://www.uaex.uada.edu/farm-ranch/crops-commercial-horticulture/ag-tech-calendar.aspx
Net Return Evaluation from 2023-2025 ARPT
One exercise for looking forward into 2026 and making seed selection decisions is to compare average net returns from the Arkansas Rice Performance Trials (ARPT). While grain yield results are useful, it can be helpful to add another layer of looking at those yields from a profitability standpoint. As always, individual operating costs, rent situations, and performance potential of cultivars can differ in a range of real world conditions.
A few notes about Table 1 – the 2026 Operating Costs come from the 2026 Enterprise Budgets. Yields are from the Arkansas Rice Performance Trial (ARPT) results averaged across all test locations for the given year. Net Returns are calculated using a rice price of $5.50 per bushel – yield is multiplied by price and then the operating cost is subtracted to arrive at the net return. No rent terms are accounted for in this example. Some cultivars were not in the ARPT for all years – this is the reason for missing data at times.
Table 1. Grain yield and net return of selected cultivars in the Arkansas Rice Performance Trials (ARPT), 2023-2025.
Cultivar |
Grain |
2026 |
2025 |
2024 |
2023 |
Mean |
2025 |
2024 |
2023 |
Mean |
|---|---|---|---|---|---|---|---|---|---|---|
|
|
|
Operating Cost |
Yield |
Yield |
Yield |
Yield |
Net Return |
Net Return |
Net Return |
Net Return |
|
|
|
$/ac |
bu/ac |
bu/ac |
bu/ac |
bu/ac |
$/ac |
$/ac |
$/ac |
$/ac |
|
Ozark |
L |
836 |
173 |
182 |
184 |
180 |
118 |
164 |
178 |
156 |
|
ProGold L4 |
L |
836 |
175 |
175 |
-- |
175 |
128 |
127 |
-- |
127 |
|
DG263L |
L |
877 |
174 |
193 |
191 |
187 |
80 |
182 |
173 |
151 |
|
DG273L |
L |
877 |
173 |
-- |
-- |
173 |
77 |
-- |
-- |
77 |
|
RTv7303 |
L |
888 |
163 |
189 |
-- |
178 |
9 |
154 |
-- |
93 |
|
CLL16 |
CL |
915 |
164 |
176 |
176 |
173 |
-13 |
53 |
55 |
35 |
|
CLL18 |
CL |
915 |
172 |
186 |
187 |
182 |
32 |
106 |
111 |
87 |
|
CLL19 |
CL |
915 |
153 |
175 |
182 |
171 |
-75 |
45 |
84 |
25 |
|
CLHA03 |
CL |
915 |
161 |
166 |
-- |
164 |
-32 |
-1 |
-- |
-14 |
|
PVL04 |
PL |
918 |
154 |
171 |
162 |
163 |
-70 |
24 |
-26 |
-19 |
|
PVL05 |
PL |
918 |
152 |
-- |
-- |
152 |
-81 |
-- |
-- |
-81 |
|
PVL06 |
PL |
918 |
180 |
-- |
-- |
180 |
71 |
-- |
-- |
71 |
|
DG563PVL |
PL |
854 |
166 |
185 |
-- |
177 |
59 |
164 |
-- |
120 |
|
RTv7231 MA |
ML |
887 |
179 |
183 |
181 |
181 |
98 |
120 |
111 |
111 |
|
RT 7331 MA |
MLH |
959 |
186 |
201 |
210 |
200 |
65 |
148 |
197 |
142 |
|
RT 7221 FP |
FLH |
968 |
186 |
-- |
-- |
186 |
58 |
-- |
-- |
58 |
|
RT 7321 FP |
FLH |
968 |
179 |
-- |
215 |
199 |
17 |
-- |
215 |
127 |
|
RT 7421 FP |
FLH |
968 |
186 |
203 |
214 |
202 |
56 |
149 |
211 |
145 |
|
RT 7521 FP |
FLH |
968 |
191 |
196 |
215 |
201 |
83 |
108 |
213 |
137 |
|
RT 7301 |
LH |
977 |
175 |
-- |
-- |
175 |
-14 |
-- |
-- |
-14 |
|
RT 7302 |
LH |
977 |
193 |
205 |
227 |
209 |
85 |
151 |
273 |
175 |
|
RT XP753 |
LH |
977 |
194 |
203 |
214 |
204 |
91 |
141 |
201 |
148 |
|
Titan |
M |
836 |
155 |
188 |
161 |
169 |
14 |
196 |
48 |
95 |
|
Taurus |
M |
836 |
177 |
176 |
186 |
180 |
138 |
132 |
189 |
153 |
|
ProGold M3 |
M |
836 |
167 |
186 |
183 |
180 |
80 |
189 |
168 |
152 |
|
RT3202 |
M |
977 |
184 |
200 |
217 |
201 |
36 |
122 |
216 |
131 |
|
CLM05 |
CM |
915 |
164 |
184 |
178 |
176 |
-15 |
96 |
64 |
54 |
Grain: L = long-grain; CL = Clearfield long-grain; PL = Provisia long-grain; ML = MaxAce long-grain; MLH = MaxAce long-grain hybrid; FLH = FullPage long-grain hybrid; LH = long-grain hybrid; M = medium-grain; CM = Clearfield medium-grain.
Links:
2025 Arkansas Rice Performance Trials
2024 Arkansas Rice Performance Trials
2023 Arkansas Rice Performance Trials
Dry Soil Conditions Impact Soil Test Values
Trent Roberts
Over the past several years there has been an increasing trend of what I would consider drier than normal fall weather. It seems that compared to 15-20 years ago we are receiving less rainfall in the August-November timeframe. When you couple lower fall rainfall with earlier crop harvest you end up with producers and consultants collecting soil samples during these periods of drought or dry soil conditions. Soil samples collected during these late summer/early fall periods when the soil is dry will likely results in soil test values that are significantly different compared to soil samples collected in late fall or winter. The two soil test values that are impacted the most by sampling times of drought are soil pH and soil test potassium (STK). We receive several phone calls each year regarding these two soil test values, and the common theme is that soil samples were collected during periods of prolonged drought and that the soil test values are always noticeably lower than samples collected in winter.
Soil pH is the measurement of hydrogen ions in the soil solution and prolonged periods of drought will often lead to a decrease in soil pH measurements compared to samples collected during periods of “normal” soil moisture or compared to samples collected during the winter (when soils generally have higher soil moisture). Research has shown that soil sampling during droughty periods can results in soil pH values that are 0.3-0.5 units less than soil samples taken during periods with adequate rainfall. Most producers and consultants notice this drop in pH when they sample in the late summer/early fall and compare values to samples that were taken during the winter. This “artificial” drop in pH due to the dry soil conditions at sampling may trigger liming recommendations so it is important to look at the trends in soil pH over time to make management decisions.
We also observe drops in STK when soils are sampled during dry conditions and this can be impacted by soil factors as well as crop residue factors. First, dry soil conditions can lead to both increases or decreases in STK depending on clay content and type. We have observed that some soils in Arkansas will exhibit lower STK values when soils are extremely dry, but we have not clearly identified what factors contribute to this phenomenon. However, we do know for certain that lack of rainfall will lead to decreased STK values following crop harvest since the majority of K remains in the crop residue. Most of our row crops will require large amounts of K to maximize yield, but much of the K that a plant takes up will remain in the residue and only a small portion is removed with the harvested grain. Potassium is unique in the fact that it will simply leach out of the crop residue and return to the soil. Some research suggests that 10 inches of rainfall are required to leach 50% of the K from the residue and that 20 inches of rain will leach 90%. Therefore, sampling immediately after crop harvest before K has leached from the residue will result in lower-than-normal STK values and may lead to K fertilizer recommendations that are not required to optimize yield in the following crop.
Perfect weather and “downtime” in our dry falls make it a great time to soil sample, but it is also important to note that soil pH and STK can be impacted when soil samples are collected during periods of dry weather. Some general rules of thumb to help guide soil sampling and interpretation are: 1) be consistent with soil sample time (attempt to soil sample a field within the same 1-2 month period each season), 2) understand that comparing soil samples taken in September will result in different soil test values (especially pH and STK) that are often lower than soil samples collected from the same area in January, and 3) use a history of soil test information to track changes in soil test values over time.
Market Update
Scott Stiles
The USDA released the monthly WASDE report on Tuesday, December 9. As customary, USDA did not update U.S. grain production estimates as part of the December report.
The only supply-side adjustment to the long-grain balance sheet was a 1 million cwt. reduction in imports, to 43 million. Exports were reduced 2.0 million cwt. to 62.0 million on continued sluggish sales and shipments of rough rice to Mexico and other Latin American markets. At 62 million cwt., 2025/26 exports are still projected to be above last year’s 60.8 million. For the week ending November 13th, U.S. long-grain export sales were running 36% behind last year’s level for the comparable week. Ending stocks were increased by 1 million cwt. to 37 million and on par with 2024/25 stocks of 37.3 million cwt. The December outlook for the 2025/26 season-average farm price is $10.50/cwt. or $4.73 per bushel. This is down 25% from last year’s $6.30 per bushel and would be the lowest average farm price since 2016/17. The projected 2025/26 PLC payment rate for long-grain now sits at 6.4 cents per pound or $2.89 per bushel. USDA’s PLC projections for all crops: 2025 PLC Payment Rates
Table 2. U.S. long-grain supply and demand.
U.S. Long-Grain Supply and Demand |
2025/26 |
monthly change |
||
|---|---|---|---|---|
unit: million cwt. |
2024/25 |
November |
December |
|
|
Beginning Stocks |
19.3 |
37.30 |
37.30 |
0.0 |
|
Production |
172 |
152.7 |
152.7 |
0.0 |
|
Imports |
42.7 |
44.0 |
43.0 |
(1.0) |
|
Total Supply |
234.1 |
234.0 |
233.0 |
(1.0) |
|
Domestic Use |
135.9 |
134 |
134 |
0.0 |
|
Exports |
60.8 |
64 |
62 |
(2.0) |
|
Total Use |
196.7 |
198.0 |
196.0 |
(2.0) |
|
Carry-Over |
37.3 |
36.0 |
37.0 |
1.0 |
|
stocks-use % |
19.0% |
18.2% |
18.9% |
|
|
Avg. Producer Price ($/cwt.) |
$ 14.00 |
$ 11.50 |
$ 10.50 |
$ (1.00) |
|
Avg. Producer Price ($/bu.) |
$ 6.30 |
$ 5.18 |
$ 4.73 |
$ (0.45) |
|
PLC Reference Price ($/bu.) |
$ 6.30 |
$ 7.61 |
$ 7.61 |
$ - |
|
Proj. PLC Payment Rate ($/bu.) |
$ - |
$ 2.44 |
$ 2.89 |
$ 0.45 |
|
Source: USDA Supply and Demand Estimates (WASDE), December 2025. |
||||
Farmer Bridge Assistance (FBA) program
Payment timing and other important dates:
-
Dec. 19 (5 p.m. ET): Deadline for producers to make sure 2025 acreage reporting is accurate.
-
Week of Dec. 22: USDA expects to release commodity-specific payment rates.
-
By Feb. 28, 2026: USDA says eligible FBA payments should be released.
Program details:
-
$12 billion total in one-time assistance tied to 2025 conditions.
-
$11 billion from the FBA Program is focused on row crops.
-
$1 billion is reserved for commodities not covered by FBA, including specialty crops and sugar.
-
No crop insurance link required to receive FBA payments. Prevented Planting acreage will not be eligible for FBA payments.
-
Eligibility: FBA applies across a broad array of row crops: Corn, soybeans, wheat, rice, cotton, peanuts, lentils, sunflowers and others, with no regional differences.
Data input for FBA payments:
-
USDA cost-of-production estimates.
-
WASDE price forecasts.
-
2025 planted acres.
-
A uniform formula modeling economic losses for the 2025 crop year.
-
Payments will cover a portion of modeled losses, scaled to the $11 billion cap.
Payment limits & eligibility:
-
$155,000 payment limit per person or legal entity.
-
$900,000 AGI test for eligibility.
-
No enhanced limit for those deriving 75% of income from farming.
UA article on FBA: Farm Bridge Assistance package comes at critical time for farmers
2026 Rice Outlook:
U.S. Long-Grain Acres:
Last week, USDA issued their preliminary 10-year Baseline Projections. Early ideas for 2026 U.S. long-grain acreage are for a 15% decline to 1.8 million acres; down from 2.119 million in 2025. That would be very similar to the 2022 long-grain planted acreage of 1.806 million. The USDA’s 10-year Baseline acreage projections are not based on grower surveys. To form the Baseline Projections, the USDA is making specific assumptions about economic conditions, policy, weather, and other global factors. A 15% reduction in Arkansas’ long-grain acreage would net about 986,000 planted in 2026 and roughly 1.07 million total acres.
Fig. 2. U.S. long-grain rice acres, 2022-2025 including 2026 projected 10-year baseline.
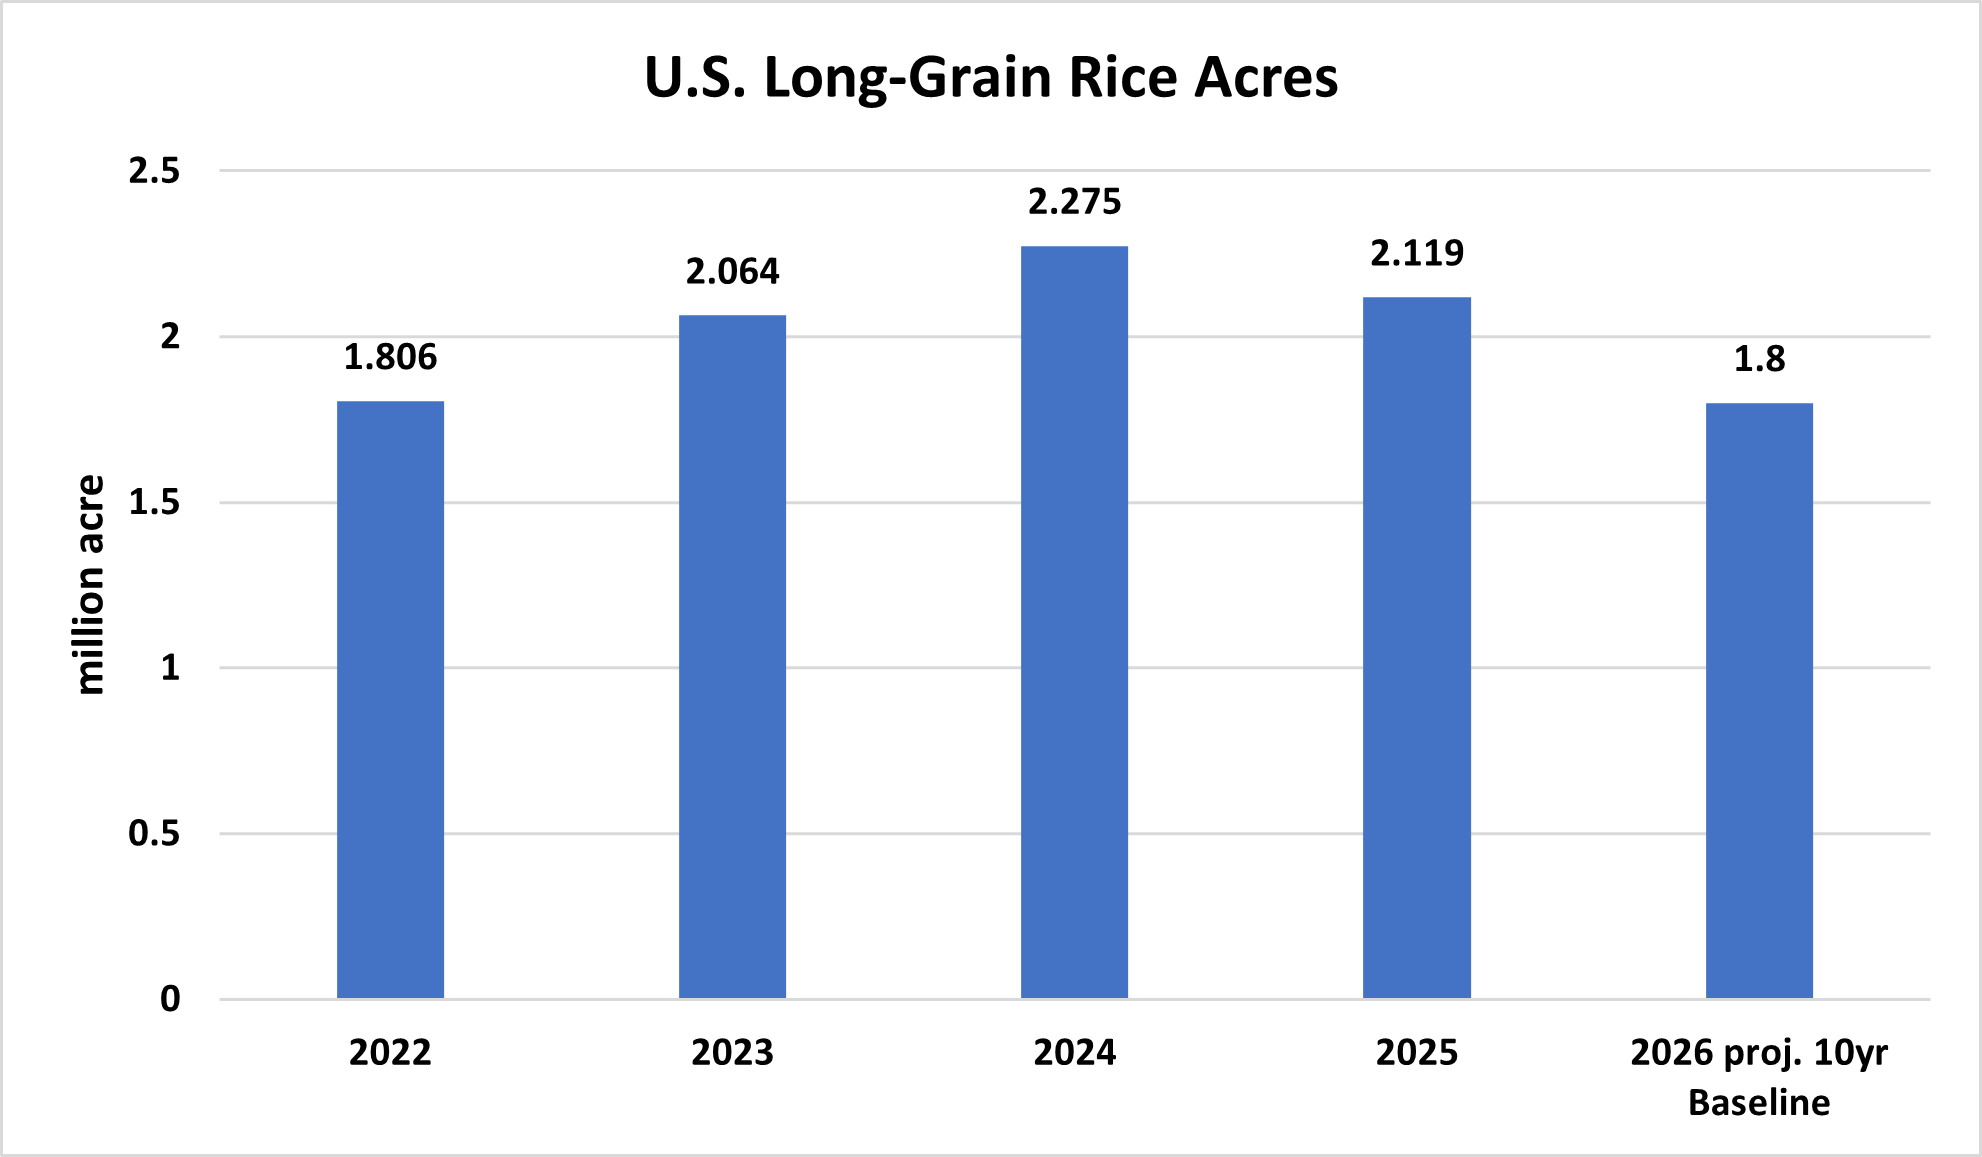 Source: USDA NASS and USDA Agricultural Projections to 2035.
Ending Stocks / Price Projections:
USDA preliminarily penciled 2026/27 U.S. long-grain ending stocks at 26 million cwt. vs the December WASDE estimate of 2025/26 stocks at 37 million cwt. On tighter ending stocks, the 2026/27 average farm price is expected to improve to $12.50/cwt ($5.63/bu.) from the projected $10.50/cwt in 2025/26.
The USDA's early baseline balance sheets can be downloaded here.
UA links and resources:
2026 Arkansas Crop Enterprise Budgets
2026 Winter Row Crop Production Meetings For specific production meeting details, contact your county extension office.
Arkansas Crop Profit/Loss Calculator
Use the Arkansas Rice Advisor Internet App!
The Arkansas Rice Advisor site https://riceadvisor.uada.edu functions like an app on your mobile device. There you can readily access the DD50 program, rice seeding rate calculator, drill calibration, fertilizer and N rate calculators, publications, and more.
Additional Information
Arkansas Rice Updates are published periodically to provide timely information and recommendations for rice production in Arkansas. If you would like to be added to this email list, please send your request to rice@uada.edu.
This information will also be posted to the Arkansas Row Crops blog (http://www.arkansas-crops.com/) where additional information from Extension specialists can be found.
More information on rice production, including access to all publications and reports, can be found at http://www.uaex.uada.edu/rice.
Acknowledgements
We sincerely appreciate the support for this publication provided by the rice farmers of Arkansas and administered by the Arkansas Rice Research and Promotion Board.
The authors greatly appreciate the feedback and contributions of all growers, county agents, consultants, and rice industry stakeholders.
Specialist |
Area |
Phone Number |
|
|---|---|---|---|
|
Jarrod Hardke |
Rice Extension Agronomist |
501-772-1714 |
|
|
Tom Barber |
Extension Weed Scientist |
501-944-0549 |
|
|
Nick Bateman |
Extension Entomologist |
870-456-8486 |
|
|
Ralph Mazzanti |
Rice Verification Coordinator |
870-659-5507 |
|
|
Trent Roberts |
Extension Soil Fertility |
479-935-6546 |
|
|
Bob Scott |
Extension Weed Scientist |
501-837-0273 |